SMC+The "SMC+" indicator is a comprehensive tool designed to overlay key Smart Money Concepts (SMC) levels, support/resistance zones, order blocks (OB), fair value gaps (FVG), and trap detection on your TradingView chart. It aims to assist traders in identifying potential areas of interest based on price action, swing structures, and volume dynamics across multiple timeframes. This indicator is fully customizable, allowing users to adjust lookback periods, colors, opacity, and sensitivity to suit their trading style.
Key Components and Functionality
1. Key Levels (Support and Resistance)
This section plots horizontal lines representing support and resistance levels based on highs and lows over three distinct lookback periods, plus daily nearest levels.
Short-Term Lookback Period (Default: 20 bars)
Plots the highest high (short_high) and lowest low (short_low) over the specified period.
Visualized as dotted lines with customizable colors (Short-Term Resistance Color, Short-Term Support Color) and opacity (Short-Term Resistance Opacity, Short-Term Support Opacity).
Adjustment Tip: Increase the lookback (e.g., to 30-50) for less frequent but stronger levels on higher timeframes, or decrease (e.g., to 10-15) for scalping on lower timeframes.
Long-Term Lookback Period (Default: 50 bars)
Plots broader support (long_low) and resistance (long_high) levels using a solid line style.
Customizable via Long-Term Resistance Color, Long-Term Support Color, and their respective opacity settings.
Adjustment Tip: Extend to 100-200 bars for swing trading or major trend analysis on daily/weekly charts.
Extra-Long Lookback Period (Default: 100 bars)
Identifies significant historical highs (extra_long_high) and lows (extra_long_low) with dashed lines.
Configurable with Extra-Long Resistance Color, Extra-Long Support Color, and opacity settings.
Adjustment Tip: Use 200-500 bars for monthly charts to capture macro-level key zones.
Daily Nearest Resistance and Support Levels
Dynamically calculates the nearest resistance (daily_res_level) and support (daily_sup_level) based on the current day’s price action relative to historical highs and lows.
Displayed with Daily Resistance Color and Daily Support Color (with opacity options).
Adjustment Tip: Works best on intraday charts (e.g., 15m, 1h) to track daily pivots; combine with volume profile for confirmation.
How It Works: These levels update dynamically as new highs/lows form, providing a visual guide to potential reversal or breakout zones.
2. SMC Inputs (Smart Money Concepts)
This section identifies swing structures, order blocks, fair value gaps, and entry signals based on SMC principles.
SMC Swing Lookback Period (Default: 12 bars)
Defines the period for detecting swing highs (smc_swing_high) and lows (smc_swing_low).
Adjustment Tip: Increase to 20-30 for smoother swings on higher timeframes; reduce to 5-10 for faster signals on lower timeframes.
Minimum Swing Size (%) (Default: 0.5%)
Filters out minor price movements to focus on significant swings.
Adjustment Tip: Raise to 1-2% for volatile markets (e.g., crypto) to avoid noise; lower to 0.2-0.3% for forex pairs with tight ranges.
Order Block Sensitivity (Default: 1.0)
Scales the size of detected order blocks (OBs) for bullish reversal (smc_ob_bull), bearish reversal (smc_ob_bear), and continuation (smc_cont_ob).
Visuals include customizable colors, opacity, border thickness, and blinking effects (e.g., SMC Bullish Reversal OB Color, SMC Bearish Reversal OB Blink Thickness).
Adjustment Tip: Increase to 1.5-2.0 for wider OBs in choppy markets; keep at 1.0 for precision in trending conditions.
Minimum FVG Size (%) (Default: 0.3%)
Sets the minimum gap size for Fair Value Gaps (fvg_high, fvg_low), displayed as boxes with Fair Value Gap Color and FVG Opacity.
Adjustment Tip: Increase to 0.5-1% for larger, more reliable gaps; decrease to 0.1-0.2% for scalping smaller inefficiencies.
How It Works:
Bullish Reversal OB: Detects a bearish candle followed by a bullish break, marking a potential demand zone.
Bearish Reversal OB: Identifies a bullish candle followed by a bearish break, marking a supply zone.
Continuation OB: Spots strong bullish momentum after a prior high, indicating a continuation zone.
FVG: Highlights bullish gaps where price may retrace to fill.
Entry Signals: Plots triangles (SMC Long Entry) when price retests an OB with a liquidity sweep or break of structure (BOS).
3. Trap Inputs
This section detects potential bull and bear traps based on price action, volume, and key level rejections.
Min Down Move for Bear Trap (%) (Default: 1.0%)
Sets the minimum drop required after a bearish OB to qualify as a trap.
Visualized with Bear Trap Color, Bear Trap Opacity, and blinking borders.
Adjustment Tip: Increase to 2-3% for stronger traps in trending markets; lower to 0.5% for ranging conditions.
Min Up Move for Bull Trap (%) (Default: 1.0%)
Sets the minimum rise required after a bullish OB to flag a trap.
Customizable with Bull Trap Color, Bull Trap Border Thickness, etc.
Adjustment Tip: Adjust similarly to bear traps based on market volatility.
Volume Lookback for Traps (Default: 5 bars)
Compares current volume to a moving average (avg_volume) to filter low-volume traps.
Adjustment Tip: Increase to 10-20 for confirmation on higher timeframes; reduce to 3 for intraday sensitivity.
How It Works:
Bear Trap: Triggers when price drops significantly after a bearish OB but reverses up with low volume or support rejection.
Bull Trap: Activates when price rises after a bullish OB but fails with low volume or resistance rejection.
Boxes highlight trap zones, resetting when price breaks out.
4. Visual Customization
Line Width (Default: 2)
Adjusts thickness of support/resistance lines.
Tip: Increase to 3-4 for visibility on cluttered charts.
Blink On (Default: Close)
Sets whether OB/FVG borders blink based on Open or Close price interaction.
Tip: Use "Open" for intraday precision; "Close" for confirmed reactions.
Colors and Opacity: Each element (OBs, FVGs, traps, key levels) has customizable colors, opacity (0-100), border thickness (1-5 or 1-7), and blink effects for dynamic visualization.
How to Use SMC+
Setup: Apply the indicator to any chart and adjust inputs based on your timeframe and market.
Key Levels: Watch for price reactions at short, long, extra-long, or daily levels for potential reversals or breakouts.
SMC Signals: Look for entry signals (triangles) near OBs or FVGs, confirmed by liquidity sweeps or BOS.
Traps: Avoid false breakouts by monitoring trap boxes, especially near key levels with low volume.
Notes:
This indicator is a visual aid and does not guarantee trading success. Combine it with other analysis tools and risk management strategies.
Performance may vary across markets and timeframes; test settings thoroughly before use.
For optimal results, experiment with lookback periods and sensitivity settings to match your trading style.
The default settings are optimal for 1 minute and 10 second time frames for small cap low float stocks.
Continuation OB are Blue.
Bullish Reversal OB color is Green
Bearish Reversal OB color is Red
FVG color is purple
Bear Trap OB is red with a green border and often appears with a Bearish Reversal OB signaling caution to a short position.
Bull trap OB is green with a Red border signaling caution to a long position.
All active OB area are highlighted and solid in color while other non active OB area are dimmed.
My personal favorite setups are when we have an active bullish reversal with an active FVG along with an active Continuation OB.
Another personal favorite is the Bearish reversal OB signaling an end to a recent uptrend.
The Trap OB detection are also a unique and Original helpful source of information.
The OB have a white boarder by default that are colored black giving a simulated blinking effect when price is acting in that zone.
The Trap OB border are colored with respect to direction of intended trap, all of which can be customized to personal style.
All vaild OB zones are shown compact in size ,a unique and original view until its no longer valid.
Wyszukaj w skryptach "order block"
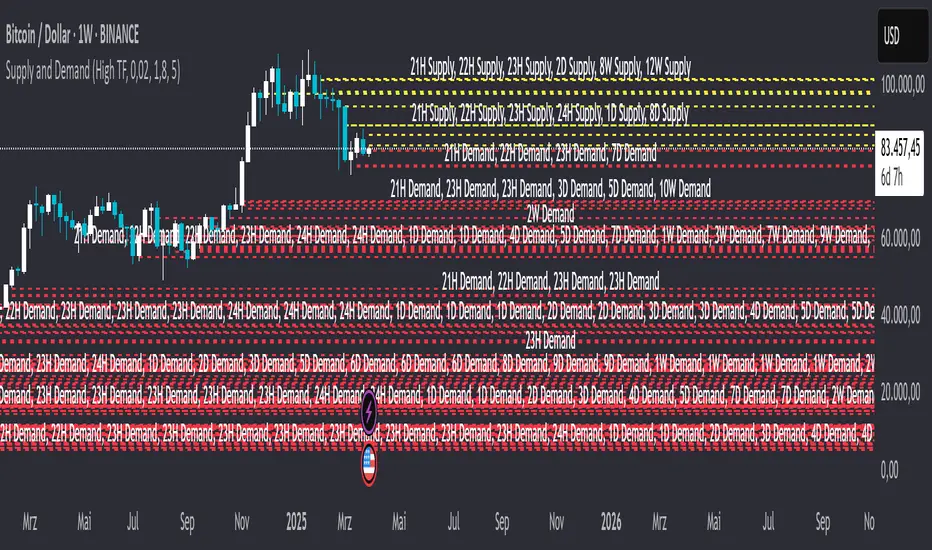
Supply and DemandIndicator Description : Precise Supply & Demand Zones with Fibonacci Adjustment
Overview:
This TradingView indicator is based on an innovative method for identifying Supply & Demand (S&D) zones. Unlike traditional methods that highlight broad areas, making precise trading difficult, this indicator allows for more accurate determination of key price levels. It combines classic S&D analysis with Fibonacci adjustments to identify institutional order blocks and probable turning points.
Functionality:
Identification of S&D Zones:
The indicator automatically detects key areas where major market participants ("Smart Money") have placed significant orders, causing strong price movements.
These areas represent untested orders that could be revisited in the future.
Supply zones indicate selling areas, while demand zones define buying areas.
Consideration of Candle Structure:
The number of candles within the consolidation phase influences the strength of a zone: the more candles present, the more significant the area.
Higher timeframes (e.g., 5D, 1W, 1M) provide more robust and reliable S&D zones as they reflect institutional activity.
All relevant levels are visible within a single timeframe, eliminating the need to switch between multiple timeframes.
Fibonacci Integration for Precision:
Instead of traditionally applying the Fibonacci retracement tool between swing highs and lows, it is unconventionally used here: from the open to the close of the candle preceding the impulse move.
This calculates an "Equilibrium Point" within the zone, serving as an optimal entry level.
Visual Representation:
The indicator highlights detected supply and demand zones with distinct colors.
A thin line marks the precise equilibrium point within the zone.
Particularly strong zones with a high probability of reaction are marked more intensely.
Important Notes:
The indicator is not a "holy grail" and is not a 100% foolproof method.
S&D zones are probabilistic and can fail despite all confluence factors.
It provides a solid, backtested strategy for identifying trading areas with high accuracy and efficiency.
Additional Features:
Customizable timeframes and sensitivity parameters
Option to mark historical S&D zones
Support for various asset classes (Crypto, Forex, Stocks)
Customizeable Deviation
Merging levels
This indicator is a valuable tool for traders looking to develop precise entry and exit strategies based on institutional order blocks.
Implied Fair Value Gap (IFVG) ICT [TradingFinder] Hidden FVG OTE🔵 Introduction
The Implied Fair Value Gap (IFVG) is distinctive due to its unique three-candlestick formation, which differentiates it from conventional Fair Value Gaps.
Implied fair value represents an estimated worth of an asset—often a business or its goodwill—based on the price likely to be received in a structured transaction between market participants at a specific point in time.
In the ever-evolving world of technical analysis, pinpointing price reversal points and market anomalies can significantly enhance trading strategies and decision-making for traders and investors. Among the advanced concepts gaining traction in this field is the Implied Fair Value Gap (IFVG), introduced by the renowned analyst Inner Circle Trader (ICT).
This tool has proven to be an effective method for identifying hidden supply and demand zones in financial markets, offering a unique edge to traders looking for high-probability setups.
Unlike traditional gaps that are visible on price charts, IFVG is a hidden gap that doesn’t appear explicitly on the chart and thus requires specialized technical analysis tools for accurate identification.
This hidden gap can signal potential price reversals and offers traders insight into high-liquidity areas where price is likely to react. This article will guide you through using the ICT Implied Fair Value Gap Indicator effectively, covering its settings, usage strategies, and key features to help you make informed decisions in the market.
🟣 Bullish Implied FVG
🟣 Bearish Implied FVG
🔵 How to Use
The IFVG indicator is designed to assist traders in recognizing hidden support and resistance zones by identifying Bullish and Bearish IFVG patterns. With this tool, traders can make better-informed decisions about suitable entry and exit points for their trades based on these patterns.
🟣 Bullish Implied Fair Value Gap
This pattern occurs in an uptrend when a large bullish candlestick forms, with the wicks of the previous and following candles overlapping the body of the central candlestick.
This overlap creates a demand zone or a hidden support level, which can act as an ideal entry point for buy trades. Often, when the price returns to this area, it is likely to resume its upward trend, presenting a profitable buying opportunity.
🟣 Bearish Implied Fair Value Gap
This pattern is similar but forms in downtrends. Here, a large bearish candlestick appears on the chart, with the wicks of adjacent candles overlapping its body. This overlap defines a supply zone or a hidden resistance level and serves as a signal for potential sell trades.
When the price returns to this zone, it often continues its downward trend, providing an optimal point for entering sell trades.
The IFVG indicator also includes various filters that traders can use to refine their analysis based on market conditions. These filters, including Very Aggressive, Aggressive, Defensive, and Very Defensive, allow users to customize the IFVG zones' width, offering flexibility according to the trader’s risk tolerance and trading style.
🟣 Example Trading Scenarios
Suppose you’re in a strong uptrend and the IFVG indicator identifies a Bullish IFVG zone. In this scenario, you could consider entering a buy trade when the price retraces to this zone, expecting the uptrend to resume. Conversely, in a downtrend, a Bearish IFVG zone can signal a favorable entry point for short trades when the price revisits this area.
🔵 Settings
Implied Block Validity Period: This parameter specifies the validity period of each identified block, taking into account the number of bars that have passed since its formation. Proper adjustment of this period helps traders focus only on relevant zones, increasing the accuracy of the analysis.
Mitigation Level OB : This option defines the mitigation level for supply and demand blocks (Order Blocks), with settings including Proximal, 50% OB, and Distal.
Depending on the selected level, the indicator will focus on closer, mid-range, or farther points for block identification, allowing traders to adjust for the level of precision required.
Implied Filter : Activating this filter allows traders to apply conditions based on the width of the IFVG zones. With options like Very Aggressive and Very Defensive, traders can control the width of IFVG zones to suit their risk management strategy—whether they prefer high-risk setups or low-risk setups.
Display and Color Settings : This section enables users to customize the appearance of the IFVG zones on their charts. Traders can set different colors for Bullish and Bearish zones, allowing for easier distinction and improved visualization.
Alert Settings : One of the standout features of the IFVG indicator is the alert system. By setting up alerts, users can be notified whenever the price approaches a demand or supply zone.
Alerts can be customized to trigger Once Per Bar (one alert per bar) or Per Bar Close (alert at the close of each bar), ensuring that traders stay updated on critical price movements without needing to monitor the chart continuously.
🔵 Conclusion
The ICT Implied Fair Value Gap (IFVG) indicator is a powerful and sophisticated tool in technical analysis, allowing professional traders to identify hidden supply and demand zones and use them as entry and exit points for buy and sell trades.
This indicator’s automatic detection of IFVG zones helps traders uncover hidden trading opportunities that can enhance their analysis.
While the IFVG indicator offers numerous advantages, it is important to use it in conjunction with other technical analysis tools and sound risk management practices.
IFVG alone does not guarantee profitability in trading; it works best when combined with other indicators such as volume analysis and trend-following indicators for a comprehensive trading strategy.

Fair Value Gaps Setup 01 [TradingFinder] FVG Absorption + CHoCH🔵 Introduction
🟣 Market Structures
Market structures exhibit a fractal and nested nature, which leads us to classify them into internal (minor) and external (major) categories. Definitions of market structure vary, with different methodologies such as Smart Money and ICT offering distinct interpretations.
To identify market structure, the initial step involves examining key highs and lows. An uptrend is characterized by successive highs and lows that are higher than their predecessors. Conversely, a downtrend is marked by successive lows and highs that are lower than their previous counterparts.
🟣 Market Trends and Movements
Market trends consist of two primary types of movements :
Impulsive Movements : These movements align with the main trend and are characterized by high strength and momentum.
Corrective Movements : These movements counter the main trend and are marked by lower strength and momentum.
🟣 Break of Structure (BOS)
In a downtrend, a Break of Structure (BOS) occurs when the price falls below the previous low and establishes a new low (LL). In an uptrend, a BOS, also known as a Market Structure Break (MSB), happens when the price rises above the last high.
To confirm a trend, at least one BOS is necessary, which requires the price to close at least one candle beyond the previous high or low.
🟣 Change of Character (CHOCH)
Change of Character (CHOCH) is a crucial concept in market structure analysis, indicating a shift in trend. A trend concludes with a CHOCH, also referred to as a Market Structure Shift (MSS).
For example, in a downtrend, the price continues to drop with BOS, showcasing the trend's strength. However, when the price rises and exceeds the last high, a CHOCH occurs, signaling a potential transition from a downtrend to an uptrend.
It is essential to note that a CHOCH does not immediately indicate a buy trade. Instead, it is prudent to wait for a BOS in the upward direction to confirm the uptrend. Unlike BOS, a CHOCH confirmation does not require a candle to close; merely breaking the previous high or low with the candle's wick is sufficient.
🟣 Spike | Inefficiency | Imbalance
All these terms mean fast price movement in the shortest possible time.
🟣 Fair Value Gap (FVG)
To pinpoint the "Fair Value Gap" (FVG) on a chart, a detailed candle-by-candle analysis is necessary. This process involves focusing on candles with substantial bodies and evaluating them in relation to the candles immediately before and after them.
Here are the steps :
Identify the Central Candle : Look for a candle with a large body.
Examine Adjacent Candles : The candles before and after this central candle should have long shadows, and their bodies must not overlap with the body of the central candle.
Determine the FVG Range : The distance between the shadows of the first and third candles defines the FVG range.
This method helps in accurately identifying the Fair Value Gap, which is crucial for understanding market inefficiencies and potential price movements.
🟣 Setup
This setup is based on Market Structure and FVG. After a change of character and the formation of FVG in the last lag of the price movement, we are looking for trading positions in the price pullback.
Bullish Setup :
Bearish Setup :
🔵 How to Use
After forming the setup, you can enter the trade using a pending order or after receiving confirmation. To increase the probability of success, you can adjust the pivot period market structure settings or modify the market movement coefficient in the formation leg of the FVG.
Bullish Setup :
Bearish Setup :
🔵 Setting
Pivot Period of Market Structure Detector :
This parameter allows you to configure the zigzag period based on pivots. Adjusting this helps in accurately detecting order blocks.
Show major Bullish ChoCh Lines :
You can toggle the visibility of the Demand Main Zone and "ChoCh" Origin, and customize their color as needed.
Show major Bearish ChoCh Lines :
Similar to the Demand Main Zone, you can control the visibility and color of the Supply Main Zone and "ChoCh" Origin.
FVG Detector Multiplier Factor :
This feature lets you adjust the size of the moves forming the Fair Value Gaps (FVGs) using the Average True Range (ATR). The default value is 1, suitable for identifying most setups. Adjust this value based on the specific symbol and market for optimal results.
FVG Validity Period :
This parameter defines the validity period of an FVG in terms of the number of candles. By default, an FVG remains valid for up to 15 candles, but you can adjust this period as needed.
Mitigation Level FVG :
This setting establishes the basic level of an FVG. When the price reaches this level, the FVG is considered mitigated.
Level in Low-Risk Zone :
This feature aims to reduce risk by dividing the FVG into two equal areas: "Premium" (upper area) and "Discount" (lower area). For lower risk, ensure that "Demand FVG" is in the "Discount" area and "Supply FVG" in the "Premium" area. This feature is off by default.
Show or Hide :
Given the potential abundance of setups, displaying all on the chart can be overwhelming. By default, only the last setup is shown, but you can enable the option to view all setups.
Alert Settings :
On / Off : Toggle alerts on or off.
Message Frequency : Determine how often alerts are triggered.
Options include :
"All" (alerts every time the function is called)
"Once Per Bar" (alerts only on the first call within the bar)
"Once Per Bar Close" (alerts only at the last script execution of the real-time bar upon closing)
The default setting is "Once Per Bar".
Show Alert Time by Time Zone : Set the alert time based on your preferred time zone, such as "UTC-4" for New York time. The default is "UTC".
Display More Info : Optionally show additional details like the price range of the order blocks and the date, hour, and minute in the alert message. Set this to "Off" if you prefer not to receive this information.

AMD-PO3-Goldbach levels [promuckaj]This script is developed on time & price, algorithmic market theory that is well explained in the book "Demystifying ICT" by Hopiplaka.
Indicators main features:
*PO3 - Goldbach(IPDA) levels which is based on the size of a price range (dealing range) as a factor of power of three (3^n).
There is PO3 numbers starting from 3 to 177147 as predefined, but also there is field for custom one so that users can experiment.
By selecting the PO3 number script calculate range low and range high using PO3 formula based on the current price and represent it on the chart into multiple levels of Goldbach numbers. At each this levels it is expected to see price that form block, fair value gap etc..., as defined in concept by ICT.
Levels:
Ext => External range
Low => Range low
High => Range high
FVG => Fair value gap
RB => Rejection block
OB => Order block
LV => Liquidity void
BR => Breaker
MB => Mitigation block
*AMD (Accumulation, Manipulation, Distribution) cycles, that can be modified by changing timings and colors.
Using PO3-Goldbach levels to identify where at the current time profile price is, there can be done trades in line with AMD cycles.
Default timings are set for Forex pairs.
*FVG, HIPPO, Displacement is well known parts of a market structure, so those three are also implemented here with some possible changes for them (colors, extension, labels...).
FVG => Fair value gap, imbalances in the market, or when buying and selling are not equal, in most cases can become a magnet for the price.
HIPPO => Hidden interbank price point objective, invention by Hopiplaka to demonstrate meaning of this "hidden" order block. It basically take the wicks of 2 consecutive bars that create a fair value gap.
DISPLACEMENT => It is practically similar to FVG but with option to measure length and strength, where in combination it will calculate and mark candle by looking back to the bars to determine the candle range standard deviation.
FEATURES:
-Multiple PO3 numbers, including special option to set your custom one
-Color and style customization
-Main levels mode, only Low, High and Equilibrium levels
-PO3 table with all PO3 calcs from multiple numbers, and mark the same levels from multiple
-Option to shift DR up or down
-Option to show you always upper/lower main DR levels (Low/High/Eq.)
NOTE:
-First of all special thanks to fxdmn that gives me idea from his indicator, how to present this through my own script.
-GB levels requires the correct symbols price calculation to work properly, everything is done by auto calc, tested well on EURUSD,SP500,DXY,Gold and BTC.

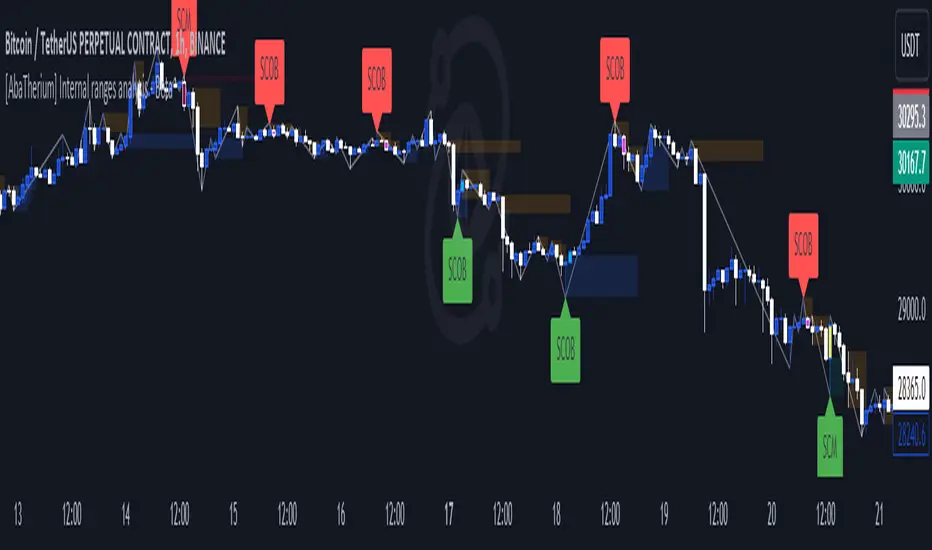
[AbaTherium] Internal ranges analysis - Beta Internal Ranges Analysis - IRA - Beta
Introduction:
Internal Ranges Analysis - IRA - Beta is a cutting-edge technical analysis tool designed to enhance your trading prowess. This beta version introduces three vital concepts: "Liquidity Sweep" , "Single Candle Mitigation Entry" , and "Single Candle Order Block Entry" . These concepts provide traders with a nuanced perspective on price action dynamics and opportunities for entry into the market.
Chapter 1: Understanding Liquidity Sweep
1.1 Liquidity Sweep Defined
- Liquidity Sweep occurs when the market price reacts after taking out a historical pivot. This phenomenon often signifies a swift move designed to clear resting buy or sell orders in the market. IRA - Beta excels at identifying and visualizing Liquidity Sweep events, allowing traders to capitalize on them.
Chapter 2: Single Candle Mitigation Entry
2.1 Introduction to Single Candle Mitigation Entry
- Single Candle Mitigation (SCM) Entry is a strategic approach employed when price action takes out the high or low of the preceding candle. This entry method is designed to capitalize on potential reversals or shifts in market sentiment. IRA - Beta offers effective tools to identify and act upon Single Candle Mitigation opportunities.
2.2 Single Candle Order Block Entry
- Traders can also explore the concept of Single Candle Order Blocks, where specific price levels act as potential entry points. This feature is integrated into IRA - Beta, providing traders with additional options for making well-informed entry decisions.
Chapter 3: Real-World Examples
Trading with internal structures needs to be done carefully with multiple confluences, like current market bias or LTF confirmations.
Here is an example on using liquidities concept and break of SCOB as confluences to enter a trade:
Conclusion:
Internal Ranges Analysis - IRA - Beta is a valuable asset for traders seeking to gain an edge in today's dynamic markets. By focusing on concepts like Liquidity Sweep, Single Candle Mitigation Entry , and Single Candle Order Block Entry , this tool equips traders with the knowledge and tools needed to make informed entry decisions. Whether you're a seasoned trader or just starting your journey, IRA - Bet a can help you navigate through the complexities of price action and make more informed trading choices.
This document serves as a comprehensive guide to Internal Ranges Analysis - IRA - Beta , highlighting its significance in understanding market dynamics and leveraging key trading concepts. Incorporating these principles into your trading strategies can lead to improved decision-making and potentially more profitable outcomes.
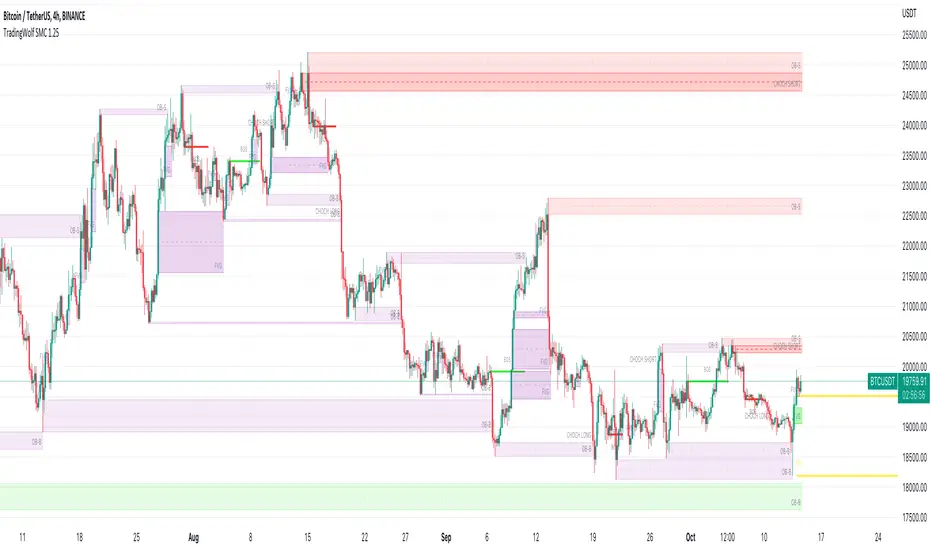
TradingWolf Smart Money
The TradingWolf Premium Smart Money Concept is a unique and enhanced selection of ideas designed to help give you an edge on the markets.
Within this one indicator you will have access to Fair Value Gap, Order Blocks, Break of Structure, Forecasting, Supply & Demand.
Below find each explanations on how to use each indicator
This script comes with the 'TradingWolf Premium' to get access, read the Author’s Instructions below.
There are extensive explanations on how to use this in our documentation on the website but we will give a simple overview here.
Order Blocks
There are several different ways people like to calculate order blocks, one of the ways we like is by using pivot points to identify levels of importance, from there we either highlight the highest/lowest closed candle or the wick. The user has the option to choose this in the settings.
As seen in the image above, you can see these levels are well respected and give people an opportunity to help where the market marker is placing their orders.
Fair Value Gaps
Fair value gaps can be a very useful concept in price action trading. They detect instances in which there are inefficiencies, or imbalances, in the market. In this case, we define imbalance as an instance in which buying and selling is not equal. This is often visualised as a large candle whose neighbouring candles’ wicks do not fully overlap the large candle. Below are a few examples of Fair Value Gap.
If price is in a downtrend and there is a fair value gap above, a trader might look to go short when that FVG fills. Inversely, if price is in an uptrend and there is a FVG below, a trader might look to go long when the FVG fills.
In this script we decided to highlight both types, one is simply marking up all technical FVGs which is the gap produced by the large candle, the other more commonly traded ones are market structure breaking ones.
These ones tend to be more respected so note they are highlighted in a separate colour to make them more visible.
If a FVG has been filled that box will dim away so it's not in your way.
ChoCh
‘Change of Character’ Hugely used by professional traders although they may not have heard of it called by this term. This is where price/market structure is trending in a certain direction but price starts to reverse.
This first happens when there is a break of structure, instead of another Lower High formed, price makes a Higher High like in the image above. This is where we highlight a break of structure or some people will just refer to this as the Choch line, once we have this we can look for an Order block / supply zone below to find an entry.
This is a hugely powerful tool dating back to one of the simplest and first concepts of trading where Market structure is King.
Peaks & Troughs
This tool helps you find potential reversal points in your support/resistance area, Simple candlestick patterns but incredibly powerful when used in confluence with our other tools.
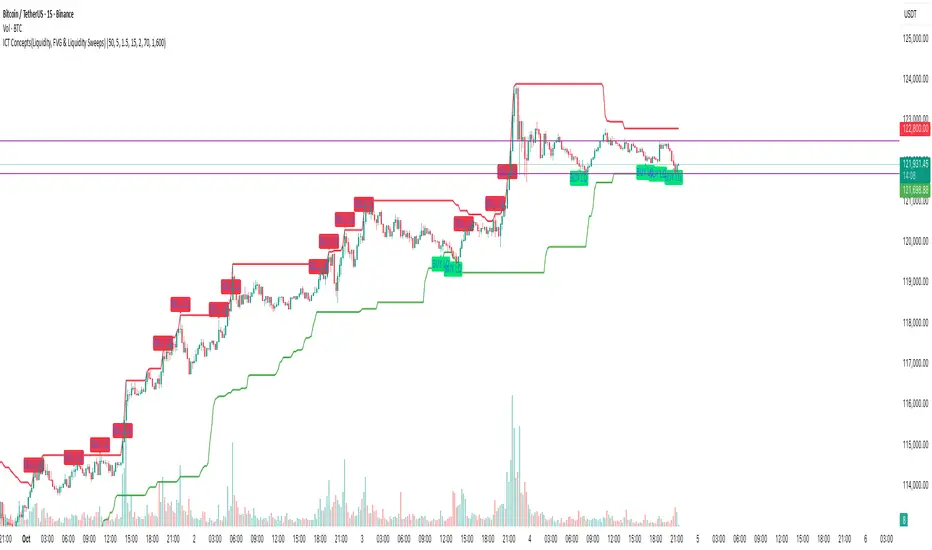
ICT Concepts(Liquidity, FVG & Liquidity Sweeps)📄 Description:
A Smart Money Concept (SMC)-based utility that blends ICT-style Liquidity Sweeps, Fair Value Gap (FVG) mapping, and Swing Structure proxies – designed for traders seeking clean precision in price imbalance analysis.
⸻
🔍 1. What This Script Does
T his indicator brings together three core Institutional Concepts:
• Liquidity Sweep Detection : Identifies buy/sell-side liquidity grabs (fakeouts) confirmed by volume spikes – a common precursor to institutional order flow shifts.
• Fair Value Gaps (FVGs) : Highlights inefficiencies between price legs using strict ICT-style 3-candle or gap-based rules. These are areas institutions often revisit.
• Swing Structure Proxy (OB Mapping) : Tracks dynamic swing highs/lows to act as proxy zones for potential order blocks and structural boundaries.
It also includes a cooldown-based signal filtering engine to prevent overfitting and noise, helping traders avoid false positives in choppy markets.
⚙️ 2. How It Works (Core Logic)
✅ A. Liquidity Sweep Engine
• Looks back N bars to find Equal Highs or Equal Lows.
• Triggers a signal only if price sweeps the level and closes on the other side with a volume spike.
• Customizable volume threshold (e.g., 1.5x average volume).
• Includes a signal cooldown period to reduce clutter and boost quality.
Bullish Sweep = Price dips below equal lows but closes higher
Bearish Sweep = Price spikes above equal highs but closes lower
Visuals: Signal arrows with alerts (BUY LQ / SELL LQ)
⸻
✅ B. Fair Value Gap (FVG) Zones
• Detects FVGs using:
• Sequential logic: Low > High (bullish), High < Low (bearish)
• Gap logic: Open gaps at bar open
• Dynamic box drawing:
• Automatically extends FVG zones until price fully closes through them.
• Different color coding for bullish (teal) and bearish (orange) gaps.
• Customizable:
• Opacity control
• Option to include/exclude gap-based FVGs
• Hide filled zones
• Limit total zones rendered (for performance)
⸻
✅ C. Swing High/Low Structure
• Uses a lookback period to find latest swing high/low levels.
• Acts as a proxy for Order Block zones or structural shift reference points.
• Plotted as red (high) and green (low) lines.
⸻
🚀 3. How to Use It
• Scalpers and Intraday Traders can use Liquidity Sweep + FVG Confluence to time reversals or catch early entries into trend continuation moves.
• Swing Traders can observe swing OB proxies and recent FVG zones to frame directional bias and target zones.
• Volume-Aware Traders benefit from the volume filter that confirms sweeps are meaningful – not just random stop hunts.
🔔 Set alerts on:
• Bullish Liquidity Sweeps
• Bearish Liquidity Sweeps
You can use this in combination with your own trend filters, or even confluence it with Order Blocks, VWAP, or EMA trend tools.
⸻
💡 What Makes It Original?
• The script doesn’t merely combine standard tools — it builds a cohesive ICT-style detection system using:
• A custom volume-confirmed liquidity sweep filter
• Dynamic FVG rendering with filled logic + performance optimization
• Visual hierarchy to avoid clutter: clean line plots, contextual boxes, and conditional signals
• Highly customizable yet lightweight, making it suitable for fast-paced decision making.
⸻
✅ Notes
• Invite-only script for serious traders interested in Smart Money and ICT concepts.
• Does not repaint signals.
• All visuals are dynamically managed for clarity and performance.
OB with SignalsOverview
The "OB with Signals" indicator is a Pine Script (version 6) tool designed for TradingView to identify Order Blocks (OBs) and generate Buy/Sell signals based on price interactions with OBs. It provides customizable visualization options and robust logic for OB detection, signal generation, and invalidation.
Features
Order Block Detection:
Identifies Bullish Order Blocks (OBs) based on the breakout of the high of the most recent bearish candle within a user-defined lookback period (default: 20 bars).
Identifies Bearish OBs based on the breakout of the low of the most recent bullish candle within the same lookback period.
Prevents overlapping OBs of the same type and filters out fully contained OBs.
Signal Generation:
Generates Buy signals when price interacts with the upper or lower half of a Bullish OB, or recovers from a false breakout above the OB.
Generates Sell signals when price interacts with the upper or lower half of a Bearish OB, or recovers from a false breakout below the OB.
Limits the number of displayed signals (default: 3) to reduce chart clutter.
Allows a minimum bar delay after OB creation before generating signals (default: 0).
Stop Loss (SL) Display:
Optionally displays Stop Loss price on OBs (default: disabled), showing the low for Bullish OBs and the high for Bearish OBs.
Visualization Options:
Toggle display of Bullish OBs, Bearish OBs, and signals (all default: enabled).
Customizable colors for Bullish OBs (default: blue, 90% transparency), Bearish OBs (default: red, 90% transparency), and OB midlines (default: white, 70% transparency).
Customizable signal label colors: current signal uses a prominent text color (default: white), historical signals use a non-prominent text color (default: red).
Adjustable background transparency for current signals (default: 30) to highlight new signals.
Invalidation and Reversal:
Invalidates OBs when price breaks through the opposite boundary (wick-based or close-based, default: wick-based).
Optionally reverses OB type on engulfing candles (default: disabled).
Performance Optimization:
Uses arrays to manage OBs and signals efficiently, removing invalidated OBs and signals to maintain chart clarity.
Notes
The indicator is designed for flexibility, with user-configurable parameters for lookback period, signal limits, and display options.
Stop Loss display is exclusive to OBs, with signal labels showing only "Buy" or "Sell" for simplicity.
Compatible with any market and timeframe on TradingView.
中文
概述
「OB with Signals」是一款基於 Pine Script(版本 6)為 TradingView 設計的指標,用於識別訂單塊(OB)並根據價格與 OB 的互動生成買賣訊號。它提供可自訂的視覺化選項以及穩健的 OB 偵測、訊號生成和失效邏輯。
功能
訂單塊偵測:
基於最近一根熊燭(紅 K)高點的突破,在使用者定義的回溯範圍(預設:20 根 K 棒)內識別看漲訂單塊(OB)。
基於最近一根牛燭(綠 K)低點的突破,在相同回溯範圍內識別看跌 OB。
防止同類型 OB 重疊,並過濾完全包含的 OB。
訊號生成:
當價格與看漲 OB 的上半部或下半部互動,或從 OB 上方的假突破回落時,生成買訊號。
當價格與看跌 OB 的上半部或下半部互動,或從 OB 下方的假突破反彈時,生成賣訊號。
限制顯示的訊號數量(預設:3 個)以減少圖表雜亂。
允許在 OB 生成後設定最小 K 棒延遲(預設:0)後才生成訊號。
止損價(SL)顯示:
可選在 OB 上顯示止損價(預設:關閉),看漲 OB 顯示低點,看跌 OB 顯示高點。
視覺化選項:
可切換顯示看漲 OB、看跌 OB 和訊號(預設:全部啟用)。
可自訂看漲 OB(預設:藍色,90% 透明)、看跌 OB(預設:紅色,90% 透明)和 OB 中線(預設:白色,70% 透明)的顏色。
可自訂訊號標籤顏色:當前訊號使用醒目文字顏色(預設:白色),歷史訊號使用非醒目文字顏色(預設:紅色)。
可調整當前訊號的背景透明度(預設:30)以突出新訊號。
失效與反轉:
當價格突破 OB 的相反邊界(基於影線或收盤價,預設:影線)時,OB 失效。
可選在吞噬 K 棒時反轉 OB 類型(預設:關閉)。
性能優化:
使用陣列高效管理 OB 和訊號,移除失效的 OB 和訊號以保持圖表清晰。
注意事項
指標設計靈活,提供可自訂的參數,包括回溯範圍、訊號數量限制和顯示選項。
止損價顯示僅限於 OB,訊號標籤僅顯示「Buy」或「Sell」以簡化呈現。
適用於 TradingView 上的任何市場和時間框架。

Trading Macro Windows by BW v2
Trading Macros by BW: Integrating ICT Concepts for Session Analysis
This indicator combines two key Inner Circle Trader (ICT) concepts—Change in State of Delivery (CISD) or Inverted Fair Value Gap (IFVG) signals with Macro Time Windows—to provide a unified tool for analyzing intraday price action, particularly during Pacific Time (PT) sessions. Rather than simply merging existing scripts, this integration creates a cohesive visual framework that highlights how macro consolidation periods interact with potential reversal or continuation signals like CISD or IFVG. By overlaying macro candle styling and borders on the chart alongside selectable signal lines, traders can better contextualize setups within ICT's macro narrative, where price often manipulates liquidity during these windows before displacing toward higher-timeframe objectives.
Core Components and How They Work Together:
Macro Time Windows (Inspired by ICT's Macro Periods):
ICT emphasizes "macro" as 30-minute windows (e.g., 06:45–07:15 PT, 07:45–08:15 PT, up to 11:45–12:15 PT) where price tends to consolidate, sweep liquidity, or form key structures like Fair Value Gaps (FVGs). These periods set the stage for the session's directional bias.
The indicator styles candles within these windows using a user-defined color for wicks, borders, and bodies (translucent for visibility). This visual emphasis helps traders focus on activity inside macros, where reversals or continuations often originate.
Borders are drawn as vertical lines at the start and end of each window (with a +5 minute buffer to capture related activity), using a dotted style by default. This creates a "study zone" that encapsulates macro events, allowing traders to assess if price is respecting or violating these zones in alignment with broader ICT models like the Power of 3 (AMD cycle).
Toggle: "Macro Candles Enabled" (default: true) – Turn off to disable styling and borders if focusing solely on signals.
CISD or IFVG Signals (Selectable Mode):
Mode Selection: Choose between "Change in the State of Delivery" (CISD) or "IFVG" (default: IFVG). Both detect shifts in market delivery during specific 30-minute slices (15–45 or 17–45 minutes past the hour in PT sessions).
CISD Mode: Based on ICT's definition of a sudden directional shift, this identifies aggressive displacements after sweeping recent highs/lows. It uses a rolling reference high/low over 6 bars, checks for sweeps (penetrating by at least 2 ticks in the last 2-3 bars), reclamation (closing beyond the reference with at least 50% body), and displacement (50% of prior range or an immediate FVG of 6+ ticks). Signals plot a horizontal line from the close, extending 24 bars right, labeled "CISD."
IFVG Mode: Focuses on Inverted Fair Value Gaps, where a bullish FVG (low > high by 13+ ticks) forms but is inverted (closed below) in the same slice, signaling bearish intent (or vice versa). This targets violations against opposing liquidity, often leading to raids on external ranges. Signals plot similarly, labeled "IFVG."
Shared Logic: Both modes enforce a 55-bar cooldown to prevent clustering, operate only during PT sessions (06:30–13:00), and use tick-based thresholds for precision across instruments. The integration with macros allows traders to see if signals occur within or at the edges of macro windows, enhancing confirmation—for example, a CISD inside a macro might indicate a manipulated reversal toward the session's true objective.
Toggle: "Signals Enabled" (default: true) – Turn off to hide all signal lines and labels, isolating the macro visualization.
How Components Interact:
Macro windows provide the "narrative context" (consolidation/manipulation), while CISD/IFVG signals detect the "delivery shift" (displacement). Together, they form a mashup that justifies publication: isolated signals can be noisy, but when filtered by macro periods, they align with ICT's session model. For instance, an IFVG inversion during a macro might confirm a liquidity sweep before targeting PD arrays or order blocks.
No external dependencies; all calculations are self-contained using Pine's built-in functions like ta.highest/lowest for references and time-based sessions for windows.
Usage Guidelines:
Apply to intraday charts (e.g., 1-5 min) or stocks during PT hours.
Look for confluence: A bull IFVG signal post-macro low sweep might target the next macro high or daily bias.
Customize colors/styles for signals (solid/dashed/dotted lines) and macros to suit your chart.
Backtest in replay mode to observe how macros frame signals—e.g., price often respects macro borders as S/R.
Limitations: Timezone-fixed to PT (America/Los_Angeles); signals are directional hints, not trade entries. Combine with ICT tools like order blocks or liquidity pools for full setups.
This script draws from community ICT implementations but refines them into a single, purpose-built tool for macro-driven trading, reducing chart clutter while emphasizing interconnected concepts. Feedback welcome!

Institutional Analyst LLM📊 Institutional Analyst Board LLM – Smart Money Confluence Scanner for XAUUSD, Forex, Crypto 🔍 Overview The Institutional Analyst Board is a complete multi-timeframe smart money toolkit designed for traders who demand clarity, confluence, and precision. It brings together institutional-grade metrics—Order Blocks (OB), Fair Value Gaps (FVG), Liquidity Sweeps, MACD/RSI...
PTS Ultimate Analysis Board (Flexible Position + Ticker)
GoldenTradeClub
GoldenTradeClub
Updated
Jul 15
PTS Ultimate Analysis Board (Flexible Position + Ticker) Version: Pine v5 Description: This indicator builds a fully customizable, multi-timeframe dashboard table that surfaces 19 key metrics for any ticker (current chart TF, 1 h, 4 h). You can position the table at the top-right or bottom-right of your chart and toggle each metric on or off. Key...
Trading Engine AI Light
GoldenTradeClub
GoldenTradeClub
Jul 14
The Trading Engine includes the best and most effective technical analysis tools. It has 27 different Buy Signal parameters and 26 different Sell Signal parameters. Furthermore, it also has 9 Stop Loss triggers for Long Positions and 8 Stop Loss triggers for Short Positions. Many of the Buy or Sell Signal parameters function as Take Profit and Stop Loss signals...
Elliott Wave Complete
GoldenTradeClub
GoldenTradeClub
Jul 4
1. Indicator Presentation Name: Elliott Wave Complete Type: Pine Script v5 overlay dashboard for TradingView Purpose: Automates Elliott Wave motive (1-5) and corrective (A-B-C) pattern detection on any timeframe, enriches it with classic ZigZag pivots, dynamic Fibonacci projection levels, optional wave-count info box, and real-time alerts—all in one...
💀⚡ PTS WIZARD 666™ ULTIMATE SUPREME V5.0 - COMPLETE FIXED ⚡💀
GoldenTradeClub
GoldenTradeClub
Jul 4
1. Indicator Presentation Name: 💀⚡ PTS WIZARD 666™ ULTIMATE SUPREME V5.0 – COMPLETE FIXED Short ID: PTS-666-SUPREME Type: Pine Script v5 overlay dashboard for TradingView Purpose: An all-in-one trading overlay that integrates advanced WaveTrend momentum, RSI/MFI analysis, POC volume profiling, multiple Fibonacci golden/ultimate zones, volume footprint & imbalance...
🔥 PTS TRADE 666™ ULTIMATE BOOKMAP + QUANTUM ENGINE
GoldenTradeClub
GoldenTradeClub
Jul 4
1. Indicator Presentation Name: 🔥 PTS TRADE 666™ ULTIMATE BOOKMAP + QUANTUM ENGINE Short ID: PTS666_QUANTUM_FINAL Type: Pine Script v5 overlay dashboard for TradingView Purpose: A cutting-edge, institutional-grade suite that unifies bookmap-style footprint volume profiling, dynamic heatmap liquidity analysis, AI-driven pattern recognition, smart-money protocols,...
🔥 PTS TRADE 666™ - ULTIMATE INSTITUTIONAL TOOL 🔥
GoldenTradeClub
GoldenTradeClub
Jul 4
1. Indicator Presentation Name: 🔥 PTS TRADE 666™ – ULTIMATE INSTITUTIONAL TOOL V2.0 Short ID: PTS666_UIT_V2 Type: Pine Script v5 overlay dashboard for TradingView Purpose: Combines institutional-grade footprint volume analysis, smart-money structure detection, statistical anomaly checks, multi-timeframe divergence, Ichimoku insights, pattern recognition, and an...
PTS Wizard
GoldenTradeClub
GoldenTradeClub
Jul 4
1. Indicator Presentation Name: PTS Wizard Short Title: PTS Wizard Type: Pine Script v5 overlay dashboard for TradingView Purpose: A unified multi-strategy toolkit that overlays key market insights—liquidity zones, smart-money structure, footprint-style volume profile, consolidation ranges, statistical deviation bands, price forecasts, and session analysis—into a...
🔥 PTS.TRADE 666™ ULTIMATE HYBRID + MTF V3
GoldenTradeClub
GoldenTradeClub
Jul 4
1. Indicator Presentation Name: 🔥 PTS.TRADE 666™ ULTIMATE HYBRID + MTF V3 Short ID: PTS666_ULTIMATE_MTF_V3 Type: Overlay dashboard for TradingView Purpose: A next-level hybrid trading suite that merges institutional-grade order-flow analysis, smart-money concepts, AI-driven insights, classic momentum oscillators (WaveTrend, divergence, “Gold” signals),...
🧙♂ PTS WIZARD V3.0 - FINAL EDITION
GoldenTradeClub
GoldenTradeClub
Jul 4
1. Indicator Presentation Name: 🧙♂ PTS WIZARD V3.0 – FINAL EDITION Short Title: PTS-WIZARD-V3-FINAL Type: Overlay trading dashboard for TradingView Purpose: A comprehensive multi-module indicator that blends classic cipher momentum signals, Elliott Wave pattern detection, advanced statistical analyses (Z-Score, Benford’s Law, Ehlers SNR), footprint-style volume...
🧙♂ PTS WIZARD V3.0 + FOOTPRINT ULTIMATE
GoldenTradeClub
GoldenTradeClub
Jul 4
Name: PTS WIZARD V3.0 + FOOTPRINT ULTIMATE Type: Overlay trading dashboard for TradingView Purpose: Combines classic cipher-style momentum signals with an advanced footprint volume profile, multi-timeframe bias, statistical filters, and a fusion-score system—displayed in a customizable on-chart dashboard. Core Modules Cipher Momentum Signals WaveTrend...
🧙♂ PTS WIZARD V3.0 - BASIC
GoldenTradeClub
GoldenTradeClub
Jul 1
PTS WIZARD V3.0 Basic – Ultimate Multi-Tool Trading Dashboard An all-in-one overlay combining classic cipher signals, Elliott Wave pattern detection, volume analytics, divergence spotting, and smart-entry timing—backed by advanced statistical filters and a live dashboard. Key Features Cipher Signals WaveTrend with overbought/oversold zones & cross signals RSI...
Trading Engine vCD AI
GoldenTradeClub
GoldenTradeClub
Jun 15
The Trading Engine includes the best and most effective technical analysis tools. It has 27 different Buy Signal parameters and 26 different Sell Signal parameters. Furthermore, it also has 9 Stop Loss triggers for Long Positions and 8 Stop Loss triggers for Short Positions. Many of the Buy or Sell Signal parameters function as Take Profit and Stop Loss signals...
Trading Engine vCD
GoldenTradeClub
GoldenTradeClub
Updated
Mar 21
The Trading Engine includes the best and most effective technical analysis tools. It has 27 different Buy Signal parameters and 26 different Sell Signal parameters. Furthermore, it also has 9 Stop Loss triggers for Long Positions and 8 Stop Loss triggers for Short Positions. Many of the Buy or Sell Signal parameters function as Take Profit and Stop Loss signals...
TE CLIENT v13
GoldenTradeClub
GoldenTradeClub
Updated
Mar 15
The Trading Engine includes the best and most effective technical analysis tools. It has 27 different Buy Signal parameters and 26 different Sell Signal parameters. Furthermore, it also has 9 Stop Loss triggers for Long Positions and 8 Stop Loss triggers for Short Positions. Many of the Buy or Sell Signal parameters function as Take Profit and Stop Loss signals...
Trading Engine v13
GoldenTradeClub
GoldenTradeClub
Updated
Mar 15
The Trading Engine includes the best and most effective technical analysis tools. It has 27 different Buy Signal parameters and 26 different Sell Signal parameters. Furthermore, it also has 9 Stop Loss triggers for Long Positions and 8 Stop Loss triggers for Short Positions. Many of the Buy or Sell Signal parameters function as Take Profit and Stop Loss signals...
Trading Engine B2B
GoldenTradeClub
GoldenTradeClub
Updated
Jan 14
The Trading Engine includes the best and most effective technical analysis tools. It has 25 different Buy Signal parameters and 24 different Sell Signal parameters. Furthermore, it also has 9 Stop Loss triggers for Long Positions and 8 Stop Loss triggers for Short Positions. Many of the Buy or Sell Signal parameters function as Take Profit and Stop Loss signals...
Trading Engine B2B FX V9
GoldenTradeClub
GoldenTradeClub
Updated
Jan 14
The VFLOW Trading Engine includes the best and most effective technical analysis tools. It has 20 different Buy Signal parameters and 18 different Sell Signal parameters. Furthermore, it also has 7 Stop Loss triggers for Long Positions and 5 Stop Loss triggers for Short Positions. Many of the Buy or Sell Signal parameters function as Take Profit and Stop Loss...
English
Select market data provided by ICE Data services.
Select reference data provided by FactSet. Copyright © 2025 FactSet Research Systems Inc.
© 2025 TradingView, Inc.
More than a product
Supercharts
Screeners
Stocks
ETFs
Bonds
Crypto coins
CEX pairs
DEX pairs
Pine
Heatmaps
Stocks
ETFs
Crypto
Calendars
Economic
Earnings
Dividends
More products
Yield Curves
Options
News Flow
Pine Script®
Apps
Mobile
Desktop
Tools & subscriptions
Features
Pricing
Market data
Trading
Overview
Brokers
Special offers
CME Group futures
Eurex futures
US stocks bundle
About company
Who we are
Athletes
Blog
Careers
Media kit
Merch
TradingView store
Tarot cards for traders
The C63 TradeTime
Policies & security
Terms of Use
Disclaimer
Privacy Policy
Cookies Policy
Accessibility Statement
Security tips
Bug Bounty program
Status page
Community
Social network
Wall of Love
Refer a friend
House Rules
Moderators
Ideas
Trading
Education
Editors' picks
Pine Script
Indicators & strategies
Wizards
Freelancers
Business solutions
Widgets
Charting libraries
Lightweight Charts™
Advanced Charts
Trading Platform
Growth opportunities
Advertising
Brokerage integration
Partner program
Education program
Look First
Close
Updated 3 hours ago
Institutional Analyst Board
Manage access
Remove from favorites
Use on chart
0
11
Jul 19
📊 Institutional Analyst Board – Smart Money Confluence Scanner for XAUUSD, Forex, Crypto
🔍 Overview
The Institutional Analyst Board is a complete multi-timeframe smart money toolkit designed for traders who demand clarity, confluence, and precision. It brings together institutional-grade metrics—Order Blocks (OB), Fair Value Gaps (FVG), Liquidity Sweeps, MACD/RSI bias, VWAP positioning, and Break of Structure (BoS)—into a single powerful visual dashboard.
This indicator is especially optimized for Gold (XAUUSD) but is also compatible with Crypto and Forex assets.
🧠 Key Features
✅ Multi-Timeframe Dashboard (5M / 15M / 1H)
✅ Order Block Detection with dynamic zones that extend until broken
✅ Fair Value Gap Detection with clear zone shading and border distinction
✅ MACD + RSI Confluence for momentum and bias alignment
✅ VWAP Positioning to identify premium/discount zones
✅ Liquidity Sweeps (internal/external range breaks)
✅ Killzone Highlighting (Asia / London / New York)
✅ Break of Structure (BoS) with advanced confluence filters
✅ Gold Bias Flags across timeframes (BUY / SELL / NEUTRAL)
✅ Dynamic Price Watermark with real-time data
✅ Fully customizable colors, transparencies, and text labels
🧠 How It Works
The Board uses institutional logic to analyze the chart in real time:
Metric Purpose
OB Zones Highlight potential smart money footprints where price is likely to react.
FVG Zones Identify imbalance areas between buyers and sellers—ideal for mean reversion entries.
MACD/RSI Confirm momentum direction and relative strength confluence.
VWAP Determine whether price is trading at a premium or discount.
Liquidity Sweeps Detect manipulative moves before major reversals.
BoS Mark potential trend reversals, filtered by institutional confluence.
Each signal is computed across 3 timeframes and visualized in a clean board that updates live. You’ll also see labels, alerts, and session overlays for maximum clarity.
📌 Ideal Use Case
This tool is perfect for:
Funded Challenge Traders (FTMO, MyForexFunds, etc.)
Gold scalpers and intraday traders
Crypto price action traders using BTC, ETH, SOL, etc.
Smart Money Concept (SMC) and ICT followers
⚙️ Customization Options
Toggle each module (OB, FVG, VWAP, MACD/RSI, etc.)
Set transparency and color for each zone type
Adjust Killzone timing (Asia, London, NY)
Control board position (Top/Bottom) and metric visibility
📈 Compatible Assets
✅ XAUUSD (optimized)
✅ Forex majors/minors
✅ Crypto pairs (BTC, ETH, SOL, etc.)
✅ Indices (GER40, NASDAQ, SPX with minor adaptation)
🛠️ Requirements
Use on TradingView v5
Set chart time to UTC+0 or UTC+3 for optimal Killzone accuracy
For crypto, redefine Killzone hours if needed (24/7 market)
🧠 Pro Tip
Pair this indicator with volume profile tools, CVD/Delta Flow, or Footprint overlays to build high-confidence trade setups with clear institutional confluence.

Structure Pro+ (BOS, CHoCH, FVG, OB)Structure Pro+ (BOS, CHoCH, FVG, OB)
Structure Pro+ is a comprehensive Pine Script indicator designed for traders who utilize Smart Money Concepts (SMC) in their analysis. This powerful tool automatically identifies and visualizes key market structure elements, helping you gain deeper insights into price action and potential institutional movements.
Key Features:
Break of Structure (BOS): Clearly identifies trend continuation by marking points where price breaks a previous swing high in an uptrend or a swing low in a downtrend.
Change of Character (CHoCH): Pinpoints potential trend reversals when price breaks a swing point against the prevailing trend, signaling a shift in market sentiment.
Fair Value Gap (FVG) / Imbalance: Automatically highlights areas where price has moved quickly, leaving behind "imbalances" that often act as magnet zones for future price action.
Mitigation Logic: FVGs are dynamically tracked and can be set to disappear from the chart once mitigated (when price returns to fill the gap).
Order Block (OB): Detects and marks potential institutional order blocks, which are crucial supply and demand zones that frequently act as strong support or resistance levels.
Customizable Settings: Tailor the indicator to your specific trading style with extensive input options, including:
Pivot sensitivity (leftBars, rightBars)
Color and line style for BOS/CHoCH
FVG display options, including color and mitigation behavior
Order Block display options and colors
Label sizing for clarity
Integrated Alerts: Stay informed with built-in alert functionalities for:
BOS occurrences (Bullish/Bearish)
CHoCH occurrences (Bullish/Bearish)
Confluent events: BOS + FVG and CHoCH + FVG, providing high-probability trade setups when structure breaks align with imbalances. The confluenceLookback setting allows you to define the maximum distance between these events for an alert.
Why Use Structure Pro+?
This indicator simplifies the complex process of identifying SMC concepts on your charts. By automatically drawing BOS, CHoCH, FVG, and OB, Structure Pro+ helps you:
Validate your directional bias with clear visual cues.
Identify potential entry and exit points around significant structural levels.
Enhance your market understanding based on institutional footprints.
Receive timely notifications for high-probability setups, so you never miss a critical market event.
Structure Pro+ is an invaluable tool for any trader looking to refine their analysis with Smart Money Concepts.

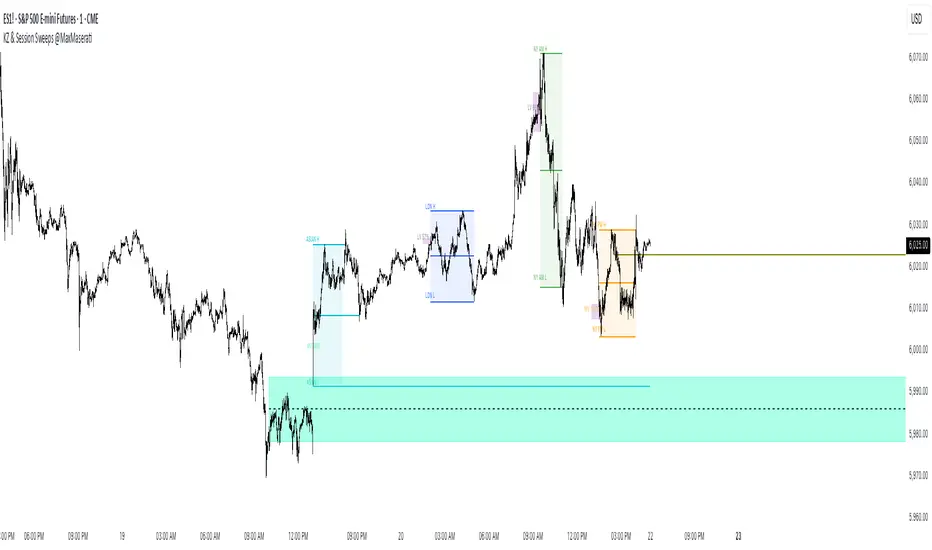
ICT Killzones Bias & Volume Sweeps @MaxMaserati📌 Overview
This indicator helps traders identify key ICT Killzones (Asian, London, NY AM, NY PM sessions) along with volume analysis and sweep detection. It highlights institutional order blocks, tracks session bias, and detects liquidity sweeps with volume confirmation.
Key Features:
✅ ICT Killzones (Asian, London, NY AM, NY PM)
✅ Volume Analysis (High/Low volume detection)
✅ Sweep Detection (Buyside/Sellside sweeps with volume confirmation)
✅ Session Bias (Bullish/Bearish bias based on price action)
✅ Customizable Sessions (Add personal trading hours)
✅ Institutional Order Build-up (30-min pre-session accumulation zones)
⚙️ Input Settings
1. Timezone Settings
Chart Timezone: Adjust to your local timezone (default: New York).
2. Session Toggles
Asian / London / NY AM / NY PM Sessions: Enable/disable each session.
NY Lunch Session: Optional session (disabled by default).
Personal Trading Time: Customize your trading hours.
3. Label Settings
Label Size: Tiny, Small, Normal, Large.
Session Labels: Customize text for High (H), Low (L), Mid (M) labels.
Background Transparency: Adjust session box opacity.
4. Volume Analysis
Show Volume Labels: Displays volume strength (🚀 Very High, 🔥 High, ⚖️ Normal, 💤 Low, 🐢 Very Low).
Volume Lookback Period: Adjusts volume comparison window.
High/Low Volume Thresholds: Define what constitutes high/low volume.
5. Sweep Detection
Buyside/Sellside Sweeps: Highlights liquidity sweeps.
Sweep Margin: Adjust sensitivity for sweep detection.
Fake Sweep Zones: Option to hide or highlight fakeouts.
Example of Session Sweep and Volume:
Here we have a Bullish Sweep of London Low session by NY AM
However, the volume was low suggesting buyers are not strong enough (M1)
And then the sellers took over and a pressure retest by the buyers of the level and then sellers entered with more power/pressure
6. Session Momentum & Bias
Show Session Bias: Indicates bullish/bearish bias for each session.
Bias Strength Threshold: Adjust sensitivity for bias detection.
📊 How It Works
1. Session Highs/Lows
The indicator tracks High, Low, and Mid prices for each session.
Lines and boxes are drawn to visualize the session range.
2. Volume Analysis
Compares current volume to historical average.
Displays volume strength with emojis (🚀, 🔥, ⚖️, 💤, 🐢).
Highlights high-volume sweeps for confirmation.
3. Sweep Detection
Detects buyside sweeps (liquidity above highs) and sellside sweeps (liquidity below lows).
Sweep zones expand if price lingers near the swept level.
4. 30 minute Pre-session Institutional order buildup
Highlights 30-minute pre-session zones where institutions may accumulate orders.
5. Session Bias
Calculates bias based on open/close price action within the session.
Displays Bullish, Bearish, or Neutral labels.
]
🎯 Trading Applications
1. Liquidity Sweeps
Look for sweeps with high volume as confirmation of institutional activity.
Fade fake sweeps (if enabled) when price reverses quickly.
2. Session Breakouts
Trade breakouts from Asian/London ranges during NY sessions.
Watch for volume expansion on breakouts for confirmation.
3. Pre- Session Institutional Block
Price often reacts to pre-session institutional position build-up (30-min before session opens).
LV:Low Volume, HV: High volume and MV: Medium Volume
NY AM Pre-Session institutional Order Build-up block with high sweep
🔧 Customization Tips
Adjust session times to normal future sessions to match your trading style.
Modify sweep sensitivity if too many/too few sweeps are detected.
Use volume thresholds to fine-tune high/low volume alerts.
📌 Final Notes
This indicator combines ICT concepts with volume analysis for a powerful trading edge. Use it alongside price action and market structure for best results at your own risk.
ICT Macro Zone Boxes w/ Individual H/L Tracking v3.1ICT Macro Zones (Grey Box Version
This indicator dynamically highlights key intraday time-based macro sessions using a clean, minimalistic grey box overlay, helping traders align with institutional trading cycles. Inspired by ICT (Inner Circle Trader) concepts, it tracks real-time highs and lows for each session and optionally extends the zone box after the session ends — making it a precision tool for intraday setups, order flow analysis, and macro-level liquidity sweeps.
### 🔍 **What It Does**
- Plots **six predefined macro sessions** used in Smart Money Concepts:
- AM Macro (09:50–10:10)
- London Close (10:50–11:10)
- Lunch Macro (11:30–13:30)
- PM Macro (14:50–15:10)
- London SB (03:00–04:00)
- PM SB (15:00–16:00)
- Each zone:
- **Tracks high and low dynamically** throughout the session.
- **Draws a consistent grey shaded box** to visualize price boundaries.
- **Displays a label** at the first bar of the session (optional).
- **Optionally extends** the box to the right after the session closes.
### 🧠 **How It Works**
- Uses Pine Script arrays to define each session’s time window, label, and color.
- Detects session entry using `time()` within a New York timezone context.
- High/Low values are updated per bar inside the session window.
- Once a session ends, the box is optionally closed and fixed in place.
- All visual zones use a standardized grey tone for clarity and consistency across charts.
### 🛠️ **Settings**
- **Shade Zone High→Low:** Enable/disable the grey macro box.
- **Extend Box After Session:** Keep the zone visible after it ends.
- **Show Entry Label:** Display a label at the start of each session.
### 🎯 **Why This Script is Unique**
Unlike basic session markers or colored backgrounds, this tool:
- Focuses on **macro moments of liquidity and reversal**, not just open/close times.
- Uses **per-session logic** to individually track price behavior inside key time windows.
- Supports **real-time high/low tracking and clean zone drawing**, ideal for Smart Money and ICT-style strategies.
Perfect — based on your list, here's a **bundle-style description** that not only explains the function of each script but also shows how they **work together** in a Smart Money/ICT workflow. This kind of cross-script explanation is exactly what TradingView wants to see to justify closed-source mashups or interdependent tools.
---
📚 ICT SMC Toolkit — Script Integration Guide
This set of advanced Smart Money Concept (SMC) tools is designed for traders who follow ICT-based methodologies, combining liquidity theory, time-based precision, and engineered confluences for high-probability trades. Each indicator is optimized to work both independently and synergistically, forming a comprehensive trading framework.
---
First FVG Custom Time Range
**Purpose:**
Plots the **first Fair Value Gap (FVG)** that appears within a defined session (e.g., NY Kill Zone, Custom range). Includes optional retest alerts.
**Best Used With:**
- Use with **ICT Macro Zones (Grey Box Version)** to isolate FVGs during high-probability times like AM Macro or PM SB.
- Combine with **Liquidity Levels** to assess whether FVGs form near swing points or liquidity voids.
---
ICT SMC Liquidity Grabs and OB s
**Purpose:**
Detects **liquidity grabs** (stop hunts above/below swing highs/lows) and **bullish/bearish order blocks**. Includes optional Fibonacci OTE levels for sniper entries.
**Best Used With:**
- Use with **ICT Turtle Soup (Reversal)** for confirmation after a liquidity grab.
- Combine with **Macro Zones** to catch order blocks forming inside timed macro windows.
- Match with **Smart Swing Levels** to confirm structure breaks before entry.
ICT SMC Liquidity Levels (Smart Swing Lows)
**Purpose:**
Automatically marks swing highs/lows based on user-defined lookbacks. Tracks whether those levels have been breached or respected.
**Best Used With:**
- Combine with **Turtle Soup** to detect if a swing level was swept, then reversed.
- Use with **Liquidity Grabs** to confirm a grab occurred at a meaningful structural point.
- Align with **Macro Zones** to understand when liquidity events occur within macro session timing.
ICT Turtle Soup (Liquidity Reversal)
**Purpose:**
Implements the classic ICT Turtle Soup model. Looks for swing failure and quick reversals after a liquidity sweep — ideal for catching traps.
Best Used With:
- Confirm with **Liquidity Grabs + OBs** to identify institutional activity at the reversal point.
- Use **Liquidity Levels** to ensure the reversal is happening at valid previous swing highs/lows.
- Amplify probability when pattern appears during **Macro Zones** or near the **First FVG**.
ICT Turtle Soup Ultimate V2
**Purpose:**
An enhanced, multi-layer version of the Turtle Soup setup that includes built-in liquidity checks, OTE levels, structure validation, and customizable visual output.
**Best Used With:**
- Use as an **entry signal generator** when other indicators (e.g., OBs, liquidity grabs) are aligned.
- Pair with **Macro Zones** for high-precision timing.
- Combine with **First FVG** to anticipate price rebalancing before explosive moves.
---
## 🧠 Workflow Example:
1. **Start with Macro Zones** to focus only on institutional trading windows.
2. Look for **Liquidity Grabs or Swing Sweeps** around key highs/lows.
3. Check for a **Turtle Soup Reversal** or **Order Block Reaction** near that level.
4. Confirm confluence with a **Fair Value Gap**.
5. Execute using the **OTE level** from the Liquidity Grabs + OB script.
---
Let me know which script you want to publish first — I’ll tailor its **individual TradingView description** and flag its ideal **“Best Used With” partners** to help users see the value in your ecosystem.

Rawstocks 15 Minute ModelRawstocks 15-Minute Model
The Rawstocks 15-Minute Model is a precision intraday trading strategy designed for the US stock market (9:30 AM - 4:00 PM ET), optimized for the 15-minute timeframe. It combines institutional order flow concepts with Fibonacci retracements to identify high-probability reversal setups while enforcing strict risk management and session-based rules.
Key Features
Time-Based Execution
Trading Hours: 9:30 AM - 4:00 PM ET (no new entries after 4:00 PM)
Force Close: All positions auto-exit at 4:30 PM ET (prevents overnight risk)
Entry Logic
Order Block + Fib Confluence:
Identifies institutional order blocks (previous swing highs/lows)
Requires price pullback to 61.8% or 79% Fibonacci level
Liquidity Confirmation:
Waits for stop runs (liquidity sweeps) before reversal entries
Exit Rules
Stop Loss: 1x ATR (14) from entry
Take Profit: 2:1 Risk-Reward (adjustable)
Visual Signals
Green Triangle: Valid long setup (pullback to bullish OB + Fib)
Red Triangle: Valid short setup (pullback to bearish OB + Fib)
Blue/Purple Background: Highlights active trading vs. close period
How It Works
Identify the Setup
Wait for a strong impulse move (break of structure)
Mark the order block (institutional zone)
Confirm Pullback
Price must retrace to 61.8% or 79% Fib level
Must occur within trading hours (9:30 AM - 4:00 PM)
Enter on Confirmation
Long: Break of pullback candle high (stop below recent swing low)
Short: Break of pullback candle low (stop above recent swing high)
Manage the Trade
Trail stop or exit at 2R (risk-to-reward)
All positions close at 4:30 PM sharp

DOP - Load-Level Identification & Setup Assistant (L.I.S.A)This toolkit is made up of more than 3+ innovative indicators that have been designed to assist people in trading smart-money concepts. Get access to a variety of trading tools & relevant data all within one indicator to create your own, smart-money trading strategy.
Catering To SMART-Money Trading Styles
Our toolkit works in any market & allows users to:
• Detect the trend of the market by displaying real-time changes in market structure.
• Detect institutional activity in the market by highlighting structural changes.
• Get automatic order block support and resistance levels in real-time to assist with order entry placement and target take profit levels.
• Timely removal of order blocks that have been run through to give a clear picture of current market structure.
How Does It Work?
The algorithm tracks key pivot points within market data and when these are broken by price movements it provides key information to the user such as when it broke structure, where it broke structure and what levels are now considered support and resistance.
Trend Bar Colouring
The trend bar colouring feature provides a clear visual indication of the market trend by colouring candles red or green depending on the last break in market structure.
Market Structure Breaks
Breaks in market structure are displayed with a single line between two candles, this indicates that there may have been a shift in market trend.
Order Block Levels
Once structure breaks it creates support and resistance levels which can help in trade entries and deciding on take profit targets; these are displayed in real-time with colour coded boxes at either the support or resistance levels. If a level has been broken it is automatically removed from the chart to give a clear representation of the current market state.
If you are using this script you acknowledge past performance is not necessarily indicative of future results and there are many more factors that go into being a profitable trader.
You can see the Author's instructions below to get instant-access to this indicator.
Iani SMC Sniper XAU v2.2 (Long+Short + News Countdown, v6)Iani SMC Sniper v2.6 — Anytime • Auto Pip • FVG 50% • OB • News Panel
Smart-Money Concepts made simple for intraday XAU/USD (works on any symbol).
Finds BOS, 50% FVG “sniper” entries, optional Order Blocks, London H/L, news countdown, and a mini info panel.
What it does
BOS (Break of Structure): detects bullish/bearish BOS after London sweep logic.
FVG 50% entries: plots precise long/short entry dots at the midpoint of the gap.
Auto TP/SL: TP = RR × risk, SL below/above recent swing with a small buffer.
Order Blocks (optional): marks the last opposite candle after BOS and alerts on OB revisit.
London High/Low: tracks session range; session filter is optional.
News countdown: shows next event time and minutes left (user-selectable timezone).
Mini Panel: top-left table with Trend (last BOS), Next news, R:R, Pip size.
Inputs (key)
Auto pip size: uses syminfo.mintick. Manual override available.
Risk:Reward (RR): default 2.0.
Pivot length: swing sensitivity.
Sessions: enable if you want signals only 12:00–20:00 (symbol timezone). Off = anytime.
News timezone: pick your own (e.g., Europe/Brussels, America/New_York).
Absolute & daily times: add your events (strings like 2025-09-17 20:00 or 14:30,16:00…).
Show labels/levels/OBs: toggle on/off.
Alerts included
BOS Bullish / BOS Bearish
BUY Entry / SELL Entry (return to 50% FVG)
Bullish OB revisit / Bearish OB revisit
TP Long/Short reached, SL Long/Short hit
NEWS WARNING (warning window only; does not block signals)
To use: Add Alert → Condition: this indicator → choose any of the alertconditions.
Best use
Bias: H1 for structure.
Execution: M15 (standard) or M5 (aggressive).
Works great on XAUUSD, but is symbol-agnostic (auto pip adapts).
Notes
News times display in the timezone you pick in settings.
OBs are a simple implementation meant for quick visual guidance.
Labels: BUY/SELL near entries, TP/SL on set and when hit, BOS up/down.
Risk disclaimer
This tool is for education only. Not financial advice. Backtest and manage risk.

Riz Goldbach FrameworkRiz Goldbach Framework maps a dynamic dealing range and a set of Goldbach-derived price levels to structure intraday decision-making. It blends range math (PO3), level clustering, session weighting, volume/volatility context, and an explainable scoring engine that can issue BUY/SELL signals with risk levels (SL/TP). It is designed for discretionary traders who want rules-based context rather than a black box.
Core concepts (how it works)
1) PO3 Dealing-Range Engine
⦁ The script builds a tri-based PO3 range around current price (Auto or Manual).
⦁ It shifts the range when price “accepts” outside (close/wick—user selectable) and adapts width with ATR so the range expands in high volatility and tightens in low volatility.
⦁ From this range it computes mid, premium/discount halves, and sub-mids.
2) Goldbach Levels (structure map)
Within the active PO3 range, fixed percentages anchor recurring behaviors:
⦁ Rejection edges: 3%, 97%
⦁ Order-block tendency: 11%, 89%
⦁ FVG tendency: 17%, 83%
⦁ Liquidity void / expansion: 29%, 71%
⦁ Breaker band: 41%, 59%
⦁ Mitigation band: 47%, 53%
⦁ Equilibrium: 50%
⦁ Touch/near logic is tolerance-based (body-only optional). The script also counts confluence clusters (2=moderate, 3+=strong) near price.
3) Market elements the script tracks
⦁ Order Blocks (OB): detected after BOS behavior when price is sitting on OB-biased GB levels (11/89).
⦁ FVG: 3-bar gaps at FVG-biased levels (17/83) with optional “% fill” confirmation.
⦁ LV bars: wide-range, high-range bars around 29/71 for displacement/voids.
⦁ Equal Highs/Lows (EQH/EQL): tolerance with labeling for sweep risk.
⦁ Circuit Breaker (CB): zone seeded at 41/59. States: intact → broken → retest → revalidated/failed. A shaded band shows the active breaker zone.
⦁ Twin Towers (TT): equal-high/equal-low doublet with spacing/volume/RSI checks, then sweep-and-return into the breaker zone for confirmation.
4) Context & filters
⦁ Trend vs Range: DMI/ADX + EMA stack infer TREND/RANGE/TRANSITION and scale the required score.
⦁ MTF alignment: compares current PO3 halves vs HTF PO3 halves (user timeframe), rewarding alignment and flagging divergence.
⦁ Fib–Goldbach confluence: checks 61.8/38.2/78.6/127.2/161.8 against key GB levels for added weight.
⦁ Session weighting: Asia/London/NY bias different GB levels; weights are higher for London/NY.
⦁ Volume-weighted liquidity: tracks volume at EQH/EQL to flag “high-commitment” sweeps.
⦁ AMD cycle (smart): accumulation/manipulation/distribution estimated from ATR regimes, sweeps, BOS continuation, divergence and PO3 shifts.
⦁ Optional filters: HTF bias, SMT divergence via a second symbol, VSA volume emphasis, news blackout session.
5) Signal engine
⦁ Modes: MMxM, Trending, or Hybrid (auto switches depending on CB acceptance + ATR expansion).
⦁ A score (0–100) aggregates weighted conditions (GB touch/confluence, AMD alignment, CB state, TT, FVG/OB interaction, HTF bias, SMT, high-volume, RSI momentum).
⦁ Adaptive threshold raises/lowers requirements in TREND vs RANGE.
⦁ Outputs: BUY/SELL label with strength (WEAK/NORMAL/STRONG), a reasons string (e.g., GB+AMD+Breaker+TT+FVG+HTF+RSI), and risk levels:
⦁ SL: rejection/structure anchored (e.g., GB3/GB97 or recent swing ± ATR).
⦁ TP1: opposite breaker (41/59).
⦁ TP2: opposite FVG tendency (17/83).
⦁ Live RR displayed on label and plotted as dashed lines.
⦁ Cooldown, session/time, weekend, and volatility gates suppress poor-quality or clustered signals.
What you see on the chart
⦁ PO3 bands: High/Low/Mid lines plus background shading for Premium (bear tint), Discount (bull tint), Equilibrium (neutral).
⦁ Goldbach lines: Major structure (0/50/100) plus the functional GB set (11/17/29/41/47/53/59/71/83/89/3/97).
⦁ Blocks & gaps: OB lines, FVG boxes (extend right, fill progress), LV box, breaker zone band, and TT logic states.
⦁ CE/MT: Central equilibrium (~3.5%/96.5%) and mid-towers (25%/75%) trigger optional alerts.
⦁ Session overlays: Asia/London/NY (optional).
⦁ Opens: Daily/Weekly (optional).
⦁ Dashboard: PO3 value, Zone (Premium/Discount/Equilibrium), AMD phase, Session, Mode (MMxM/Trending/Hybrid), CB state, nearest GB tag, Market context (TREND/RANGE/TRANS), recent Events, and rolling win-rate tallies (signals/CB/TT) from the current chart session.
How to use it (workflow)
1. Pick a preset
⦁ Minimal: only core structure.
⦁ Standard: levels + dashboard.
⦁ Full: adds sessions + GBT window overlays.
2. Choose range logic
⦁ PO3 Auto is reactive and scales with ATR.
⦁ Manual PO3 is for precise range control.
3. Scope your bias
⦁ Confirm Zone (Premium/Discount), CB state, and AMD phase; check MTF row if enabled.
⦁ Strong setups usually appear when session-weighted GB levels + confluence ≥ 2 + CB revalidated + AMD = manipulation → distribution (short) or accumulation → manipulation (long).
4. Act on signals (optional)
⦁ When a label prints, read the factors string and score.
⦁ Use plotted SL/TP1/TP2 lines and RR.
⦁ Respect cooldown, news blackout, and volatility filter.
Inputs you might tweak
⦁ PO3: Auto/Manual, acceptance by Close vs Wick, adaptive widening/tightening.
⦁ Levels: Major-only vs All; tolerance %; wick vs body touches.
⦁ Signals: Mode, score threshold, cooldown, confirm on close.
⦁ CB/TT: breaker width %, spacing window & tolerance, suppress bars after TT.
⦁ Filters: HTF timeframe, SMT symbol, VSA on/off, news blackout session.
⦁ Visuals: colors, line opacity, label sizes, dashboard position/size.
⦁ FVG/LV/CE/MT: fill %, and per-event alerts.
Alerts available
⦁ BUY/SELL signal, PO3 shift, GB touch (with tag), CB broken/retest pass/fail, TT setup/confirmed, OB tagged, FVG formed/filled, LV expansion, CE/MT touches.
Limitations & notes
⦁ Signals are contextual—they depend on the active PO3, tolerance, filters, session weighting, and volatility regime.
⦁ HTF requests depend on broker/exchange data and the timeframe you assign; if HTF is empty or illiquid, features degrade gracefully but may be less informative.
⦁ Win-rate tallies are session-local (not a historical performance guarantee).
⦁ Parameter choices (e.g., tolerance, breaker width, thresholds) materially change behavior.
Disclaimer
This tool is for educational/informational purposes only. It does not constitute financial advice, an invitation to trade, or performance assurance. Markets involve risk—always test on replay/paper and manage risk independently.

HIGH VOLUME BY EAGLE EYESHIGH VOLUME BY EAGLE EYES is a smart price–volume analysis tool that helps traders identify high-probability breakout zones based on consolidation, breakout direction, and volume strength.
Key Features:
Order Block Detection: Finds bullish and bearish order blocks after periods of consolidation.
Volume Analysis: Supports three calculation methods — Simple, Relative (to average volume), and Weighted — to gauge volume strength.
Breakout Filtering: Confirms breakouts only when accompanied by above-threshold volume.
Visual Markers: Plots color-coded boxes on the chart showing the breakout zone with live volume multipliers.
Customizable Settings: Adjustable lookback periods, breakout threshold, maximum number of displayed blocks, and volume sensitivity.
Usage:
Apply to your chart with your desired timeframe.
Watch for green boxes (bullish breakouts) and red boxes (bearish breakouts).
Boxes are removed if price mitigates them (invalidated by opposite movement).
Works on all instruments and timeframes, especially effective in volatile markets for breakout traders.

Key Liquidity💧Advanced-Pro-J-Algo# 💧 Key Liquidity Advanced Pro - Multi-Timeframe Institutional Analysis
## 🏆 **Premium Institutional Trading Indicator**
Transform your trading with this comprehensive **multi-timeframe liquidity analysis tool** that combines **Smart Money Concepts (SMC)** and **ICT methodology** into one powerful indicator. Designed for serious traders who demand institutional-grade analysis.
---
## 🔥 **Key Features**
### 💧 **Multi-Timeframe Key Liquidity Levels**
- **HTF (Higher Timeframe)**: Major institutional levels with real-time alerts 🚨
- **LTF (Lower Timeframe)**: Precision entry/exit levels for optimal timing
- **CTF (Current Timeframe)**: Flexible analysis for any chart timeframe
- **Smart Mitigation Detection**: Automatically removes hit liquidity levels
- **Professional Labels**: Clean timeframe identification (4H, 1H, etc.)
### 🏦 **Institutional Order Blocks**
- **📦 Smart Money Order Blocks**: Identify where institutions placed large orders
- **Volume-Weighted Analysis**: Bullish/Bearish strength calculations
- **Professional Labels**: 🏦📦 H (High) and 🏦📦 L (Low) markers
- **Violation Detection**: Automatic cleanup when order blocks are broken
- **Overlap Prevention**: Clean chart presentation without clutter
### 🚨 **Advanced Alert System**
- **HTF Liquidity Hit Alerts**: Never miss major institutional level breaks
- **Detailed Notifications**: Timeframe, price, and timestamp information
- **Smart Frequency Control**: No spam - only meaningful alerts
- **Mobile Ready**: Perfect for Trading View mobile app notifications
### 📊 **Market Structure Analysis**
- **MSB (Market Structure Breaks)**: Current trend direction changes
- **Premium/Discount Zones**: ICT-style institutional price zones
- **Clean Presentation**: Only shows current MSB, removes historical clutter
### 🔄 **Trading Session Analysis**
- **Multi-Session Support**: Asian, London, New York sessions
- **Session Overlaps**: Highlighted with special bar coloring
- **Configurable Display**: Show 0-10 previous days of session data
- **High/Low Tracking**: Session-specific price levels
---
## 🎯 **Perfect For**
### **Trading Styles:**
- ✅ **Forex Trading** (ICT/SMC methodology)
- ✅ **Index Trading** (institutional analysis)
- ✅ **Crypto Trading** (smart money concepts)
- ✅ **Swing Trading** (HTF liquidity levels)
- ✅ **Scalping** (multi-timeframe precision)
### **Methodologies:**
- ✅ **Smart Money Concepts (SMC)**
- ✅ **Inner Circle Trader (ICT)**
- ✅ **Institutional Order Flow**
- ✅ **Liquidity Hunting Strategies**
- ✅ **Market Structure Trading**
---
## ⚙️ **Comprehensive Settings**
### **Master Controls:**
- 💧 Enable/Disable Key Liquidity Levels
- 🏦 Enable/Disable Order Blocks
- 📊 Enable/Disable Market Structure Breaks
- 🎯 Enable/Disable Premium/Discount Zones
- 🔄 Enable/Disable Trading Sessions
### **Customization Options:**
- **Timeframe Selection**: Choose your HTF and LTF periods
- **Color Schemes**: Professional color coding for each timeframe
- **Display Limits**: Control chart clutter with smart limits
- **Text Sizing**: Scalable labels for any screen size
- **Extension Options**: Short, Current, or Max line extensions
### **Alert Configuration:**
- 🚨 HTF High Liquidity Hit Alerts
- 🚨 HTF Low Liquidity Hit Alerts
- Smart frequency control to prevent spam
---
## 🎨 **Visual Excellence**
### **Professional Design:**
- **Clean Interface**: No chart clutter, only relevant information
- **Consistent Labeling**: All elements perfectly aligned and positioned
- **Smart Color Coding**: Visual hierarchy based on timeframe importance
- **Emoji Integration**: Instant visual recognition (💧🏦📦📊)
### **Label System:**
- **Liquidity Levels**: Timeframe labels (4H, 1H, etc.) with tooltips
- **Order Blocks**: 🏦📦 H/L institutional liquidity markers
- **Market Structure**: MSB break notifications
- **Sessions**: Clear session identification and overlaps
---
## 🔬 **Technical Implementation**
### **Performance Optimized:**
- Efficient memory management with `max_bars_back()` settings
- Smart array handling to prevent performance issues
- Clean object deletion to maintain chart responsiveness
### **Advanced Logic:**
- **Pivot Detection**: Sophisticated swing high/low identification
- **Mitigation Algorithms**: Smart detection of liquidity level hits
- **Volume Analysis**: Institutional strength calculations
- **Multi-Timeframe Security**: Proper HTL/LTF data handling
---
## 📈 **How to Use**
### **Setup:**
1. Add indicator to your chart
2. Configure your preferred HTF (default: 4H) and LTF (default: 1H)
3. Enable desired features via Master Controls
4. Set up TradingView alerts for HTF liquidity hits
### **Trading Workflow:**
1. **Identify Bias**: Use HTF liquidity levels for market direction
2. **Find Entries**: Use LTF levels and Order Blocks for precision entries
3. **Confirm Structure**: Check MSB for trend continuation/reversal
4. **Time Entries**: Use session analysis for optimal timing
5. **Get Alerted**: Never miss major HTF liquidity hits
---
## 🏅 **Why Choose This Indicator?**
### **Professional Grade:**
- Combines multiple premium concepts into one comprehensive tool
- Institutional-quality analysis typically found in expensive platforms
- Clean, professional presentation suitable for serious trading
### **Complete Solution:**
- No need for multiple indicators - everything in one package
- Covers all aspects of modern institutional trading methodology
- Suitable for beginners learning SMC/ICT and professionals alike
### **Constantly Updated:**
- Built with modern Pine Script v6
- Performance optimized for all timeframes
- Clean code structure for reliability
---
## 🚨 **Important Notes**
- **Timeframe Compatibility**: Works on all intraday timeframes (not suitable for daily/weekly/monthly)
- **Best Performance**: Recommended for 1m-4H chart timeframes
- **Alert Setup**: Configure TradingView alerts for mobile notifications
- **Education**: Best used with understanding of SMC/ICT concepts
---
## 📞 **Support & Updates**
This indicator represents months of development and testing, combining the best of institutional trading analysis into one comprehensive tool. Perfect for traders who demand professional-grade analysis and real-time alerting.
**🎯 Take your trading to the institutional level with Key Liquidity Advanced Pro!**
---
*Disclaimer: This indicator is for educational and informational purposes. Past performance does not guarantee future results. Always practice proper risk management.*
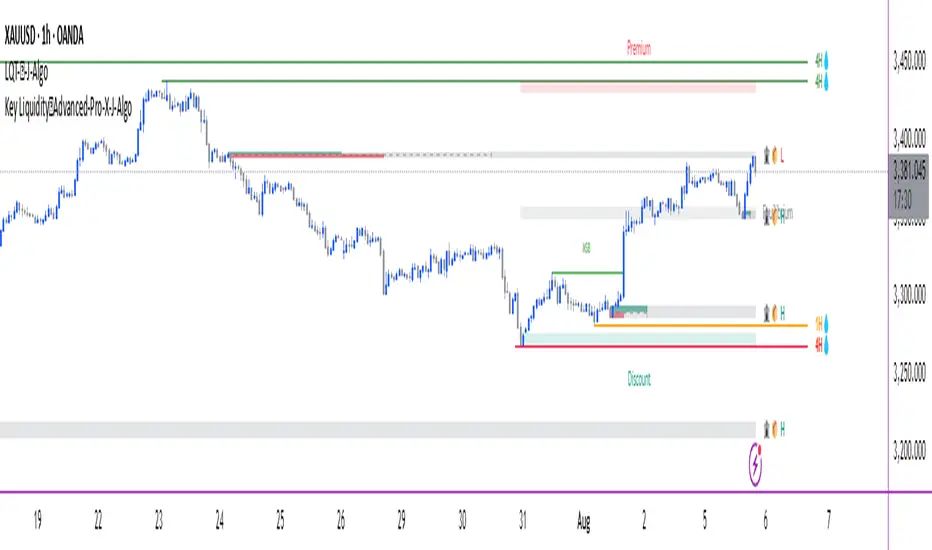
Wave N + KDJ + Volumi + SMC + IchimokuWave N + KDJ + Volume + SMC + Ichimoku Indicator
Overview
This script is a multi-layered technical indicator designed to provide traders with enhanced market insights by combining five key methodologies:
• Wave N Pattern (Price Action)
• KDJ Oscillator (Momentum)
• Volume Filtering (Confirmation)
• Smart Money Concepts (Order Blocks) (Institutional Activity)
• Ichimoku Cloud (Trend and Support/Resistance)
By integrating these components, the indicator identifies high-probability trading signals, early warnings of trend shifts, and institutional price zones to improve decision-making in volatile markets.
⸻
How It Works
1️⃣ Wave N Pattern (Price Action Structure)
The Wave N pattern is a classic price action formation that helps spot potential trend reversals and continuations:
• A Bullish Wave N is detected when a higher low and a higher high structure appears.
• A Bearish Wave N is detected when a lower high and a lower low structure forms.
2️⃣ KDJ Oscillator (Momentum & Trend Strength)
The KDJ Indicator is a variation of the Stochastic Oscillator that adds a third line, J, to amplify sensitivity to trend movements.
• J > 50 indicates bullish momentum.
• J < 50 indicates bearish momentum.
• The script includes an early warning signal when J crosses 50, suggesting a possible trend shift.
3️⃣ Volume Filtering (Trade Confirmation)
To avoid false signals, the script integrates volume confirmation:
• A signal is valid only if the volume is above the 20-period EMA of volume.
• This ensures that trade signals are supported by strong market participation.
4️⃣ Smart Money Concepts (Order Blocks)
Order Blocks represent areas of institutional interest, where large traders accumulate or distribute positions.
• The script detects bullish order blocks (potential support) and bearish order blocks (potential resistance).
• These areas help identify optimal entry and exit points.
5️⃣ Ichimoku Cloud (Trend & Dynamic Support/Resistance)
The Ichimoku Cloud is used to confirm trend direction:
• Baseline (Kijun-sen) acts as a key trend filter.
• Senkou Span A & B form the cloud (Kumo), indicating dynamic support/resistance.
• Buy signals require price to be above the baseline, while sell signals require price to be below the baseline.
⸻
Trading Signals & Visual Elements
✅ BUY Signal (Green Arrow)
Occurs when:
• A Bullish Wave N forms
• J > 50 (Bullish KDJ Signal)
• Volume is above EMA threshold
• Price is above the Ichimoku Baseline
❌ SELL Signal (Red Arrow)
Occurs when:
• A Bearish Wave N forms
• J < 50 (Bearish KDJ Signal)
• Volume is above EMA threshold
• Price is below the Ichimoku Baseline
⚠️ Early Warning (Trend Shift Signal)
• An early warning appears when J crosses 50, indicating a possible upcoming trend shift.
• The line color changes based on the potential move:
• Green/Blue → Possible Uptrend
• Red/Orange → Possible Downtrend
⸻
Why This Indicator is Unique?
Unlike simple trend-following indicators, this script:
• Combines Price Action, Momentum, Volume, and Institutional Order Flow for a multi-dimensional approach.
• Filters out weak signals using volume confirmation and Ichimoku.
• Provides early warnings before major trend shifts.
• Visualizes Smart Money Order Blocks, giving traders an edge in spotting institutional zones.
⸻
Best Timeframes & Markets
📊 Recommended Timeframes:
• 1H & 1D (works best on medium/long-term trends)
💹 Markets:
• Crypto, Forex, and Stocks
This indicator is designed for traders who value confluence and strong confirmation in their strategies. Whether you are a trend trader, swing trader, or institutional flow analyst, this tool can help refine your decision-making process.
🚀 Optimize your trades with Wave N + KDJ + Volume + SMC + Ichimoku! 🚀

Price Action SuiteThe TRN Price Action Suite incorporates a treasure trove of time and price action concepts. It includes a set of trading tools that, when combined, allow for a more accurate view of the market. This enables traders to find high probability entry points before the market moves to the next liquidation level.
Features of the TRN Price Action Suite:
(Inverse) Fair Value Gaps (FVG)
Order Blocks (OB)
FVG and OB with Cumulative Volume Delta
Volume Imbalances
Market Structure
Liquidity levels
Sessions
Kill zones/Opening Range
The indicator helps traders to easily identify favorable market conditions and high probability trade setups. It automatically finds time and price action concepts and displays them in an intuitive way on the chart. One of the highlights is the detection of Fair Value Gaps and Order Blocks in connection with Cumulative Volume Delta (approx.). You will not find this connection anywhere else.
Fair Value Gaps (FVGs)
A fair value gap occurs when there are inefficiencies in the market or imbalanced buying and selling pressures. Fair value gaps can become a magnet for the price before continuing in the same direction. Special attention should be paid to FVGs that are supported by support and resistance levels, as these offer a higher probability of success for trades. Additionally, the indicator plots inverse FVG (iFVG). These are FVG that are “closed” by a FVG in the other direction. IFVGs are a strong sign of the market to continue in the direction of the iFVG.
In addition to the FVGs you see on the chart, you can add also FVGs from a higher timeframe including the cumulative buy/sell volume. For this you can set “Timeframe 1” and “Timeframe 2” in the settings to your preferred timeframes. E.g. you trade on a 5-minute chart, and you want to see FVGs from 4 hours and a daily chart, then you set Timeframe 1 to 4 h and to Timeframe 2 to 1 D.
Order Blocks and Volume Imbalances can also be shown from higher timeframes.
Order Blocks (OBs)
Order blocks are areas on the chart where a high concentration of limit orders was found in the past. They can serve as potential support or resistance areas. These represent areas in the market where there is an oversupply (supply) or an excess demand (demand). They are often key zones for potential turning points or continuations of the current trend. A bullish OB, for example, is the last bearish candle before a significant uptrend.
FVGs and OBs with Cumulative Volume Delta
The TRN Price Action Suite can show FVGs and OBs with the corresponding Cumulative Volume Delta (CVD). It is a metric to analyze market dynamics by tracking the net difference between buying and selling volumes over a specific timeframe. It is used to determine the strength of the FVG/OB. The FVG/OB includes two bars on the left side, indicating the cumulative buy volume in green as well es the cumulative sell volume in red. At the right side of the FVG/OB box the ratio of the cumulative buy/sell volume is displayed. A high ratio over 1, for example 1.5, indicates a lot of buying pressure. On the hand, a ratio far below 1, for example 0.66, indicates a lot of selling pressure.
Volume Imbalances (VIBs)
Volume Imbalances indicate a price gap from the previous close, but unlike gaps, there is no absence of trading activity within a specific price range. Bullish VIs have opening and closing prices above the previous close, with overlap between the current low and previous high. Bearish VIs are vice versa.
Market Structure
The market structure represents the dominant trend in the market. It is based on swing highs and lows. For instance, if the price makes higher highs (HH) and higher lows (HL) the market structure represents an uptrend. Vice versa if price makes lower lows (LL) and lower highs (LH) the market trend is down.
If the market structure is up, traders can enter positions in a pullback. For this, a trader could use a FVG or an OB as an entry condition.
Market Structure Shift (MSS) (Change of Character (ChoCh))
A market structure shift occurs when the market transitions from one dominant trend to a different one, often signaling a potential change in the underlying market dynamics. A MSS signals the start of a new trend. It signals the change from an uptrend to a down trend and vice versa. Therefore, it is sometimes called change of character (ChoCh). A valid MSS should ideally occur in a strong supply or demand zone. This indicates that the market may be approaching a trend reversal or consolidation.
Break of Structure (BOS)
A break of structure happens when the market breaks out of its established trading range or pattern. The market continues its dominant trend, indicated by the last MSS.
In an uptrend, for example, each time the price breaks through a new high, a "bullish BOS" is formed. This indicates that the market can overcome previous resistance levels and continue to rise.
Levels
One core concept in trading is that price flows to areas of liquidity. Natural liquidity areas are the current day open, high, low (CDO, CDH, CDL) or the previous day high, low, close (PDH, PDL, PDC). The same is true for the current week (CWO, CWH, CWL) and the previous week (PWH, PWL, PWC).
Pay special attention in case some of these levels are close together. Then these levels serve like a magnet for the price. The TRN Price Action Suite indicator can cluster these levels fully automatically together to give the trader the flexibility to focus solely on the trading part.
Sessions
Sessions are the trading hours during which the banks are actively trading. The three main trading sessions:
Asia: Most of the volume from the Asian players are handled within this session.
London: This is where the European players are most active.
New York: In the New York session all the USA players are active as well as all the other American players. Furthermore, a lot of global players are active in this session as well.
Killzones
A kill zone in trading refers to a specific time period during the trading day when the market experiences increased volatility and liquidity. It is an opportunity for traders to capitalize on potential price movements and generate profits. There are several different killzones during the day.
There are three different types of killzones:
Indices/Futures: This one is suitable if you trade products like the ES, NQ, FDAX, CL or Stocks, Options.
Forex: If you trade Forex this setting will mark the most liquid periods of the day.
Opening Range: In case you trade the opening range of the sessions, use this setting.
Trading Example
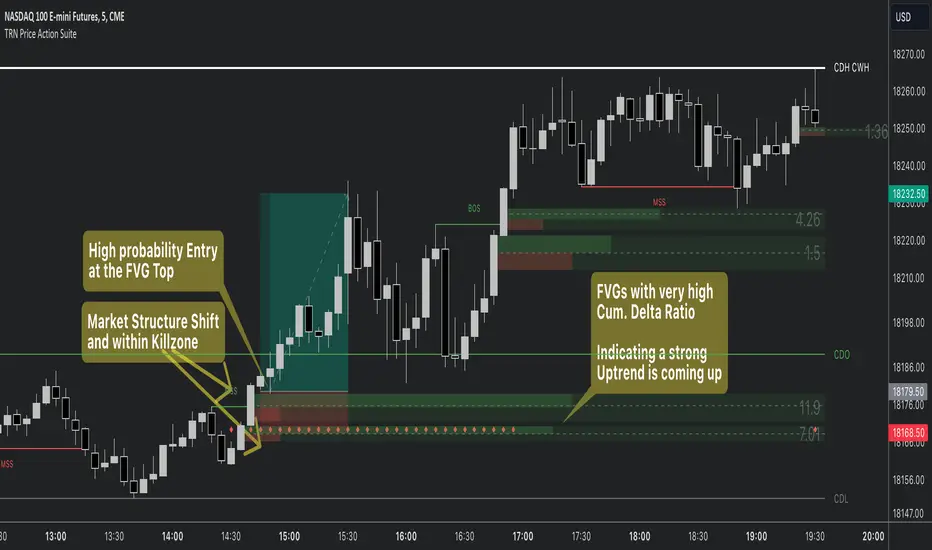
[KVA] ICT Dealing rangesNaive aproach of Dynamic Detection of Dealing Ranges:
The script dynamically identifies dealing ranges based on sequences of upward or downward price movements. It uses arrays to track the highest highs and lowest lows after detecting two consecutive up or down bars, a fundamental step towards understanding market structure and potential shifts in momentum.
ICT Concept: Order Blocks & Fair Value Gaps. This aspect can be linked to the identification of order blocks (bullish or bearish) and fair value gaps. Order blocks are essentially the last bearish or bullish candle before a significant price move, which this script could approximate by identifying the highs and lows of potential reversal zones.
Red and Green Ranges for Bullish and Bearish Movements:
The script separates these movements into red (bearish) and green (bullish) ranges, effectively categorizing potential areas of selling and buying pressure.
ICT Concept: Liquidity Pools. Red ranges could be indicative of areas where selling might occur, potentially leading to liquidity pools below these ranges. Conversely, green ranges might indicate potential buying pressure, with liquidity pools above. These areas are critical for ICT traders, as they often represent zones where price may return to "hunt" for liquidity.
Horizontal Lines for High and Low Points:
The indicator draws horizontal lines at the high and low points of these ranges, offering visual cues for significant levels.
ICT Concept: Breaker Blocks & Mitigation Sequences. The high and low points of these ranges can be seen as potential breaker blocks or areas for future mitigation sequences. In ICT terms, breaker blocks are areas where institutional orders have overwhelmed retail stop clusters, creating potential entry points for trend continuation or reversal. The high and low points marked by the indicator could serve as references for these sequences, where price might return to retest these levels.
Customizability and Historical Depth:
With inputs like rangePlot and maxBarsBack, the indicator allows for customization of the number of ranges to display and how far back in the chart history it looks to identify these ranges. This flexibility is crucial for tailoring the analysis to different trading strategies and timeframes.
ICT Concept: Market Structure Analysis. The ability to adjust the depth and number of ranges plotted caters to a detailed market structure analysis, an essential component of ICT methodology. Traders can adjust these parameters to better understand the distribution of buying and selling pressure over time and how actions have shaped price movements.
